Research Administration Data (RAD)
Important Note: As of July 5, 2023, existing RAD reports are accessible but historical. Until new RAD 2.0 based reporting solutions are available, please request data from grantrpt@uw.edu until further notice.
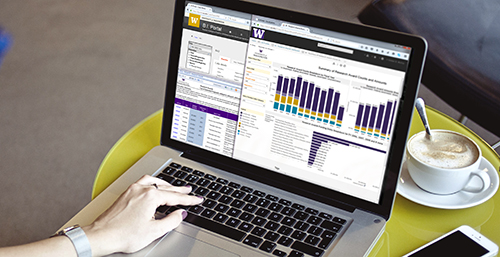
Research Administration Data (RAD) is available in a variety of formats on UW’s Business Intelligence (BI) Portal. RAD is built using research data captured from UW’s System to Administer Grants Electronically (SAGE). SAGE data is exported to the Enterprise Data Warehouse (EDW) and represented by three comprehensive BI Portal reporting tools: Reports, Visualizations and Cube.
Why use RAD
The three tools within the BI Portal allow you to improve the quality of your reports by using actual SAGE data and include additional analysis parameters. Answer questions such as:
- Which grants during last fiscal year were allocated to our college and by what subdepartment?
- How do the last three fiscal years compare with respect to grant awards/proposals?
- Are industry grants in my department going up?
- Are there year-over-year award changes in my college/department?
- How many proposals involve human subjects?
- Within my department/college, who is submitting proposals and for how much?
You can also view a full list of proposals and awards based on:
- One or more specified principal investigators (PIs)
- A specific FinOrg code
- Specific words or phrases that are included in the eGC1 short/long title
RAD Benefits
- Look at a cross-cutting view of proposals and awards across departments or within departments.
- Quickly see trends and outliers in funding and conduct customized analyses.
- Forecast future funding opportunities based on success factors.
- Quickly view and download a list of all proposals and award details based on a specific kind of research (identified by keyword or phrase), or for a specified PI.
RAD Overview
Three reporting tools offer the following information:
- BI Portal Reports
- Research Awards
- Research Proposal Details
- Research Proposals
- Research Subawards
- Research Budget Expenditures
- BI Portal Visualizations
- Summary of Research Award Counts and Amounts
- Summary of Research Proposal Counts and Amounts
- Overview of Research Total Expenditures
- Comparison of Research Direct and Indirect Expenditures
- Summary of Research Total Expenditures by Funding Entities
- BI Portal Cube
- All SAGE research administration data, compiled into a cube, available for analysis and customized report building.
BI Portal Tool Details
Reports

The BI Portal RAD Reports offer ready-to-view, detailed reporting of award status, compliance and eGC1 summaries, including Principal Investigator information. Create customized lists for summaries, then download to perform additional analysis. Reports will answer questions such as:
How many proposals involve human subjects?
Within my department/college, who is submitting proposals and for how much?
Visualizations
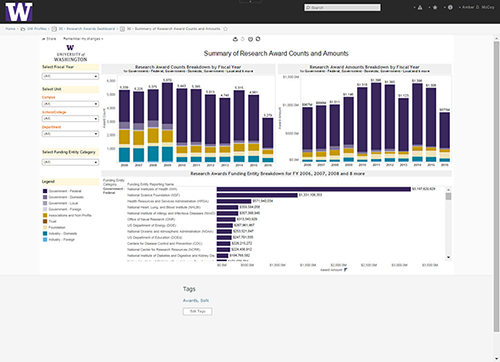
The BI Portal RAD Visualizations provide high-level views of department/college research grants. Filter the data to capture the information you need and quickly generate a visual report. Visualizations will answer questions such as:
Are industry grants in my department going up?
Are there year-over-year award changes in my college/department?
Cube
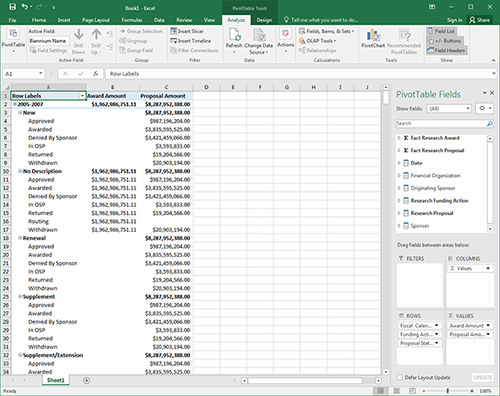
The BI Portal RAD Cube allows for a deep-dive, drag and drop analysis to answer complex questions regarding sponsor details, department and subdepartment data as well as specific date comparisons. Users who analyze data and are familiar with pivot tables will benefit the most from the Cube. The Cube will answer questions such as:
Which grants during last fiscal year were allocated to our college and by what subdepartment?
How do the last three fiscal years compare with respect to grant awards/proposals?