Human Subjects Division
Report Safety/Compliance Information

Table of Contents
Before You Begin
Do you need to report the information to HSD?
- Is UW the reviewing IRB for the study? If not, and the study is reviewed by an external IRB, you do not typically need to report to HSD. Follow the external IRB’s reporting policies and report to other UW offices as required. Review the External IRB Checklist for more information. If the UW IRB is the reviewing IRB, proceed to the next question.
- Does the information fall under one of the reportable categories listed below? If yes, submit a Report of New Information (RNI) to report in Zipline within the time frame noted.
- Is it probably related to the research? If not, no need to report to HSD.
- Is it minor noncompliance? If yes, only report if it also fits into one of the categories listed below.
- Multi-institutional research? Reporting requirements may differ depending upon the IRB review arrangements. When the UW IRB is the reviewing IRB and it falls under one of the reportable categories listed below, report to HSD. You may also need to report to the any affected relying institutions depending on their policies.
For a detailed description of HSD’s reporting requirements, definitions, guidance, and examples of what to report and what not to report, review SOP RNI Reporting by Researchers.
Contact HSD’s Regulatory Affairs team at hsdreprt@uw.edu with any questions.
Types of Reportable Information
Report Within 24 Hours
- Qualifying Medical Problem covered by the UW HSAP
- Breach (or risk of breach) or loss of subject confidentiality or privacy
- Inappropriate access or use of protected health information (PHI)
Report Within 3 Business Days
- Incidental incarceration of a research subject in a study that the IRB has not approved for the inclusion of prisoners and where study activities or data collection will continue while the subject is incarcerated
- DOD funded EFIC studies only: All incidental incarceration of a research subject even if study activities and data collection will not occur during the incarceration
Report Within 10 Business Days
- Unanticipated problem
- Unanticipated adverse device effect
- Serious noncompliance
- Continuing noncompliance
- All safety monitoring or DSMB reports
- Emergency deviation from IRB approved procedures made without IRB review to eliminate an apparent immediate hazard to a subject or others
- Continuation of research after IRB approval has lapsed, because the procedures are of direct benefit to the individual subjects or withholding the researcher intervention (if any) may increase risks to subjects
- Complaint from a subject or other person about the study, which cannot be resolved by the research team
- Audit, inspection, compliance or safety-related inquiry from a federal agency including initial notification of an upcoming audit or inspection
- Information that indicates a new or increased risk or safety issue (or a decrease in study benefits) (e.g. A publication in the literature indicates an increase in the frequency or magnitude of a previously known risk, or uncovers a new risk; revised IB, package insert, or device manual; changes to FDA-approved labeling, restrictions, or warnings)
- Humanitarian Use Devices (HUDs) – Medical Device Reports (MDRs) or incidents where a HUD may have caused or contributed to a death or serious injury, or has malfunctioned and would be likely to cause or contribute to a death or serious injury if the malfunction were to recur
- Premature suspension or termination of some or all of the research by the sponsor, researcher, or institution
Who should submit the Report of New Information (RNI) in Zipline?
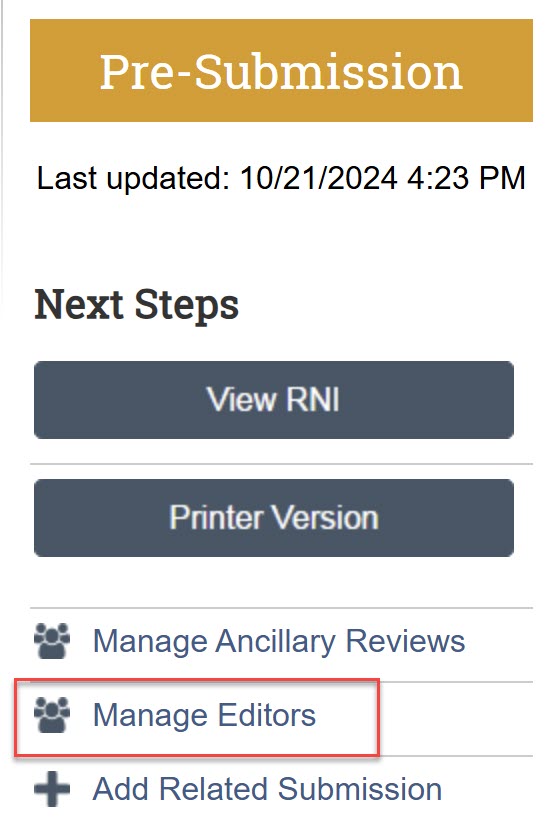
Anyone can submit an RNI in Zipline, it is not limited to the PI or PI proxy. Use the “Manage Editors” activity to add others who can submit or edit the RNI. Take care to add only those who you want to be able to edit or submit the RNI.
The RNI may be linked to one or more studies, sites, or modifications when the RNI is submitted, but it is not required. HSD can also link studies, sites, and modifications to an RNI at any time during review. The PI and any PI proxies of all related (linked) studies are able to edit the RNI submission and receive email notifications about the review.
Steps to Submit an RNI
The RNI Supplement is required for all RNIs submitted by researchers.
You should also upload any documents related to the RNI, such as a copy of the DSMB report.
Never include identifiable subject information! Redact any identifiers from your materials prior to submission.
Depending on the situation, you may need to modify your study due to the RNI. For example:
- New risk information needs to be added to the consent form
- Repeated noncompliance with a study procedure may mean that the process for conducting the procedure needs to be changed
If you believe that you need to update your study application as a result of the RNI, submit the changes separately as a modification.
You can create an RNI from My Inbox or from a related study or site
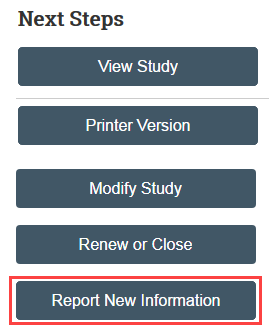
Complete the form, link any related studies or modifications, and upload any related documents, including the RNI Supplement
For detailed instructions:
Add study team members that you want to be able to edit and submit the new information. The PI and any PI proxies of linked studies automatically have edit permissions.
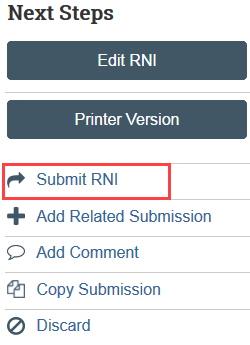
The Submit RNI activity must be completed by an RNI Editor once the RNI is ready to go to HSD.
Select Submit RNI in the RNI workspace and provide required verifications
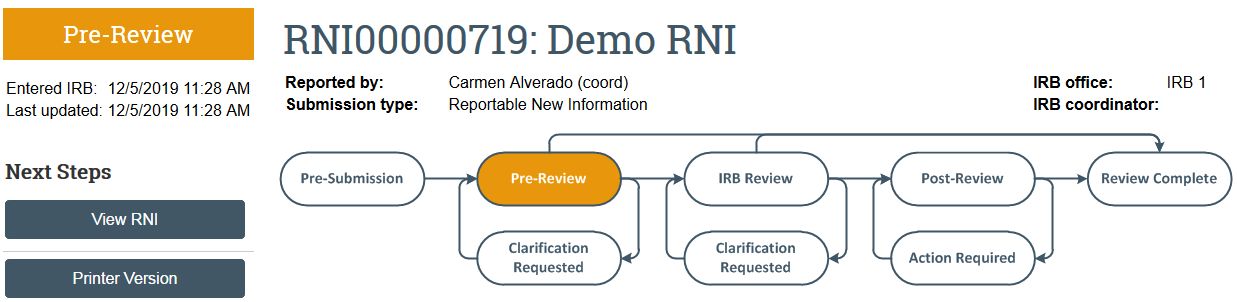
What To Expect After Submitting
The RNI transitions to Pre-Review state and is now in HSD’s queue for review.
Once the RNI has been reviewed, the submitter and the PI, PI proxies, and primary contact of any related studies will receive a notification that:
- HSD and the IRB have made a final determination and no additional action is needed at this time; OR
- HSD and the IRB requires more information or additional action