A newly created budget will contain one worksheet with a default title of Primary Worksheet. The title of the Primary Worksheet integrates to Workday as the Grant Name, and so should be changed to a meaningful title. You can rename the worksheet in its settings panel. This worksheet cannot be deleted.
Worksheets: Video Overview
Adding a Worksheet
Use the Add Worksheet link in the left navigation menu to create additional worksheets for your budget. When you select this link, a dialog will open. You can choose the type of worksheet you want to add, and edit its default title.
The following image shows the dialog for adding a worksheet, with the default values.
The worksheet types are:
Internal UW Worksheet
Use this when other departments within the UW are collaborating on a project.
Values from this worksheet display on the Budget Summary under the corresponding object/sub-object codes.
Subaward Worksheet
Use this to capture the budget of an outside institution to which the UW is subcontracting some portion of a project’s work.
Values from this worksheet roll up to the Budget Summary under the (03) Other Contractual Services object code. Subawards support custom external F&A rates and external benefit rates.
For step-by-step guidance on setting up Subaward Worksheets and UW F&A, review the following job aids:
Use this type under certain circumstances when a defined portion of a larger project budget involves the fabrication of equipment and the sponsor is unwilling to pay indirect costs related to fabrication.
Values from this worksheet roll up to the Budget Summary under the (06) Equipment object code.
Each additional worksheet will appear on the left navigation menu in the order added.
On the left navigation menu, there is a “more options” menu icon (3 blue vertical dots) following each non-primary worksheet name. Click on the “more options” icon to display the menu and select Delete Worksheet. A confirmation dialog displays stating “Deleting a worksheet is permanent and cannot be reversed. All costs on this worksheet will be lost.”
The following image shows the dialog window:
You have the option to cancel and keep the worksheet, or to delete the worksheet.
If you were viewing the worksheet when you deleted it, the Budget Summary will display. Otherwise what you were viewing will not change.
Worksheet Header
Every worksheet has a header that displays its title and number. This header is always visible when you are in the worksheet.
When you create a worksheet, you have the option to edit the default title. At any other time, you can edit the title in its Worksheet Settings section, described below.
Each worksheet has a unique identifier assigned by the system. This number starts with the letter W and is displayed in the header following the title. For example, W111234.
Worksheet Settings
This section of the worksheet displays just below the header. By default, it is collapsed. Select the section to expand it.
The following image shows the section collapsed, with the description “Add required fields, worksheet details, and configure F&A”:
There are several sections of data that you can edit:
The following image shows the general information section:
This section contains the following fields:
Worksheet Type
You selected this when you created the worksheet and it cannot be changed.
Title
Use this field to edit the default title; this is a required field.
The field has a maximum length of 300 characters allowing each worksheet to have a unique name. Below the field you will see a hint that shows the number of characters used (0/300). In the left navigation menu, if the title length is greater than the navigation menu width, it will display with an ellipsis (…) ; you can see the full title by hovering over it.
In order for SAGE Budget worksheet titles to match the Workday grant naming convention, after a worksheet has been created, a prefix is automatically added based on the Worksheet Type (Internal UW Worksheet, Subaward Worksheet, or Fabrication Worksheet). Note: You will not see the prefix in SAGE Budget.
To help reduce confusion when submitting a MOD or ASR with worksheets that make modifications to existing award lines, it is important to clearly identify which award line each worksheet corresponds to.
For ASRs with SAGE Budget worksheets that move Advance Spend award lines into Open status, the best practice is to put the corresponding GR# in the title of the worksheet within the SAGE Budget itself.
For MODs, budget worksheets can be linked to a grant worktag from within the MOD itself.
Cost Center Receiving Funding appears for the primary worksheet only; Fiscally Responsible Cost Center appears for all other worksheets.
Search for a department/unit name, cost center name, or number. A results list will appear after you’ve entered a few characters; select the appropriate one.
This field is required.
Workday Security Grant Hierarchy
This required field allows you to search for and then set a Level 4 grant hierarchy for each SAGE Budget Worksheet so that it can be integrated with grants in Workday and provide the necessary permissions.
Search for a department/unit name or Cost Center, and a list of choices display. Select the appropriate value. Check with your department if you’re unsure which value to use.
The following image shows the results list when searching for “biochem”:
Box Number for Official Correspondence
Enter the appropriate value. This field is optional.
Cascade Other Costs Entries
“Cascade” means that the value entered for a worksheet cost in one period is automatically carried forward to future periods, adjusted for inflation.
By default, Other Costs entries are not cascaded across periods. In the Budget Settings, you can choose to enable cascading for your entire budget. Note: This Budget Setting will only affect newly added costs, not existing ones, and will not affect the Primary Worksheet, as it exists prior to your selecting this setting.
You can override the cascade setting for any individual cost entry.
Worksheet Default Inflation Rates
The following image shows the default inflation rates:
There are three inflation rates that are used in calculating values. The rates apply to all budget periods.
If you edited the values in the Budget Settings, they will be the default values for a newly created worksheet. However, Budget Settings changes will not affect any existing worksheet values.
Salary – applies to personnel salary entries; the default value is 2%
Tuition – applies only to tuition entries; the default value is 3%
General – applies to all other cost entries; the default value is 0%
You can edit these values for any individual worksheet, and the changes will be applied to any newly added costs.
APL, Prorated Direct Costs (PDC), and Fixed Fee
The following image shows the APL, Prorated Direct Costs, and Fixed Fee settings with all sections open:
APL and Prorated Direct Costs (PDC)
Select the toggle switch to enable this option. PDC is the Prorated Direct Costs. A message will appear briefly over the bottom of the page indicating that APL is being added to your budget, followed by a message saying the addition is complete.
Once enabled, when adding a personnel cost, you have the option of using APL benefits for that person. When you do so, an icon (atom) will appear following the person’s name.
Prorated Direct Costs (PDC) are automatically added when APL is enabled, except on fabrication worksheets. The system will add a 19-10 line item to the Other Costs section of the worksheet. The amount for a given period is equal to the PDC Rate times the period costs subject to the Modified Total Direct Cost (MTDC) base (excluding any 19-xx costs).
Note: When APL is enabled on the primary worksheet, PDC includes all of the costs on the primary worksheet including first $25,000 of any 03-62 cost on the primary worksheet and the first $25,000 of any subaward worksheets. Review Budget Calculation Formulas for details.
Fixed Fee
Select the toggle switch to enable this option. The Base Type and Fixed Fee Rate fields will display.
There are two defined base types for use with Fixed Fee and an option to create a custom base. The default base is Total Costs (TC).
Total Costs (TC) includes all object/sub-object codes except
19-40 which is Fixed Fee itself
Total Costs less Equipment (TC less E) includes all object/sub-object codes except
All 06 Equipment object/sub-object codes
19-40 which is Fixed Fee itself
Custom – selecting this base will open a modal where you can choose which object/sub-object codes you want to include for Fixed Fee.
Note: Both the Total Costs and Total Costs less Equipment bases also include Facilities and Administrative (F&A), object/sub-object code 25-99.
The default rate for Fixed Fee is 5.7% and can be edited. The Fixed Fee amount is equal to the rate times all of the object/sub-object costs in the selected or custom base.
Subaward Worksheet Note: If APL and Fixed Fee are included on the Primary Worksheet, you will see related instruction text in the Subaward Worksheet Settings. The text reads:
Note: Since APL is applied to the Primary Worksheet, Fixed Fee settings are shown. Subaward worksheet Fixed Fee Base Type is set to Total Costs. All other Fixed Fee settings will default to the Primary Worksheet settings.
The following image shows this text:
Sea Pay
The following image shows the Sea Pay section of the worksheet settings with the option enabled.
Select the “Includes Sea Pay” toggle switch to enable this option. As you add personnel, you will be able to include sea pay as needed. Sea pay can be added for personnel on the primary worksheet and on internal and fabrication worksheets. Review Salary and Benefit Costs for details on adding sea pay for personnel.
When a person has sea pay, an “anchor” icon will appear next to their name on the worksheet and budget summary.
Participant Support Costs (PSC)
Enable the Participant Support Costs indicator when using an Internal UW Worksheet for direct costs for stipends or subsistence allowances, travel allowances, and registration fees paid to or on behalf of participants or trainees (but not employees) in connection with conferences or training projects.
All costs on this worksheet will be identified as Participant Support Costs in Workday at time of award.
The following image shows the Participant Support Costs (PSC) section of the worksheet settings with the option enabled.
Fabrication Budget (with F&A)
Enable the Fabrication indicator when using an Internal UW Worksheet for deliverable fabrication with F&A costs. Deliverable Fabrication is defined as something that is built by UW, but the Sponsor will take possession of the item. For deliverable fabrication, an Internal Worksheet should be used as it does have an F&A section and the costs are subject to F&A.
All costs on this worksheet will be identified as fabrication costs in Workday at time of award.
The following image shows the Fabrication Budget (with F&A) section of the worksheet settings with the option enabled.
For standard (non-deliverable) fabrication, a Fabrication Worksheet should be used. It does not have an F&A section and costs are not subject to F&A.
F&A Settings
There are no default settings for Facilities & Administrative costs. You will need to set these values for each worksheet. You can define a custom F&A rate, which is described below following the non-custom options.
The following image shows the F&A settings section:
Start by using the Activity Location drop-down menu to select a location. Choices are:
APL
South Lake Union Campus
Off Campus
On Campus
Research Vessel
WA Natl Primate Research Center (WaNPRC)
Harborview
VA Med Ctr
Then select your Sponsored Program Activity Category from its drop-down menu. See GIM 13: Activity Types for definitions. Choices are:
Organized Research
Instruction
Other Sponsored Activities
Note: If you selected APL, the type defaults to Organized Research and cannot be edited.
Select the appropriate Sponsored Program Activity Type. Note: This field is required.
The list is organized in descending alphabetical order; the Sponsored Program Activity Type prefix (OSA, OR, I) corresponds to the Sponsored Program Activity Category.
OSA: Professional Development Public Service (UW External)
OSA: Other Sponsored Activity
OSA: IPA/JPA/Staff Assignment
OSA: Equipment
OSA: Construction
OSA: Clinical Trial Non Federal Sponsor (including Industry Sponsored)
OR: Research: Basic
OR: Research: Applied
OR: Other Training: Research
OR: Fellowship: Research Undergraduate
OR: Fellowship: Research Graduate or Professional
OR: Development
OR: Clinical Trial, Federal
I: Training and Development (UW Internal)
I: Fellowship: Non Research Undergraduate
I: Fellowship: Non Research Graduate or Professional
If appropriate, select the checkbox to indicate “This worksheet is part of an industry sponsored clinical trial.”
If you selected WA Natl Primate Research Center (WaNPRC) for your Activity Location, then you will need to choose a Primate Center Rate Type rather than a Sponsored Program Activity Category. The types are: Core, Federal Other, and Non-Federal Other.
For the Base Type, the system will use a default setting based on your choice of Activity Location.
The defaulted Base Types are:
Modified Total Direct Costs (MTDC)
Total Direct Costs (TDC)
Salary & Wages (S&W)
The rules for Base Type choice are as follows.
Activity Location
Base Type
South Lake Union Campus OR Off Campus OR On Campus
MTDC
If Clinical Trial is also selected, then TDC
WaNPRC
MTDC
Research Vessel
S&W
A table below the Base Type information displays the Default F&A rate for each period. A second column displays the F&A Rate in Use.
Note: Fabrication worksheets cannot charge any F&A costs, so a statement to that effect displays in place of the fields.
To use a custom F&A rate for your worksheet, start by selecting the toggle to enable this feature. The Base Type field will become editable, as will the rates in the F&A Rate in Use column.
These additional base types will display in the drop-down menu:
Total Direct Costs less Equipment & Tuition (TDC less E&T)
Custom… – used to fully define what costs are subject to F&A
When you select a custom base type, a dialog will display, allowing you to select which costs to include. See Custom F&A Base Types for details.
This section of your worksheet displays calculated totals, with one column for each period, and one for the All Periods value.
The following image shows an example of this section for a budget with APL Fixed Fee included.
The subsections are:
Total Direct Costs – the total of all salary, benefit, and other cost entries
Facilities and Administrative – the amount of F&A, with details when the subsection is expanded
APL Fixed Fee – this only displays when enabled in the worksheet settings
Total Worksheet Costs – the sum of the Total Direct Costs and the F&A
When you expand the F&A section, you will see the base type and activity location in the Description column. For each period and the All Periods column, there are rows for the following values, to clearly show the calculation results:
Total Direct Costs
Costs Subject to F&A, or Costs Subject to Subrecipient F&A for subaward worksheets
F&A Rate, or Subrecipient F&A for subaward worksheets
F&A Costs, or Subrecipient F&A Costs for subaward worksheets
View your budget’s history by selecting the Snapshots & History link at the bottom of the left navigation menu. Snapshots & History displays all point-in-time snapshots taken of the budget directly by you or automatically by the system. A snapshot is simply a complete copy of your budget as it existed at that point in time, allowing you to view the details.
If your budget does not yet have any snapshots, you will see this message displayed: “Snapshots record your budget at a certain point in time to help you keep track of changes. You haven’t added any snapshots yet.”
Once your budget has a snapshot, you will see a table listing them. The following image shows an example of this page.
The table columns are:
Timestamp – displays the date and time the snapshot was created. Select this link to open a read-only view of this point-in-time budget.
Snapshot Name/Description – contains either a system generated description with the connected eGC1, ASR, or MOD reference number. A user can also create a snapshot with a custom description using the ‘Create a Snapshot’ link which can be edited and/or deleted..
Saved By – displays the name of the user whose actions created the snapshot.
Delete button/icon – this removes a user-generated snapshot. Anyone who can edit your budget can delete a manually added snapshot. You cannot delete a system-generated snapshot.
Use the Create a Snapshot link next to the header to capture the state of your budget at any time. The system will enter a default description of “Snapshot on date, time”. You can then click in the description field and enter your own description.
The system will automatically capture a snapshot when these actions occur:
You create a new budget by copying an existing budget.
Applications
You connect a budget period to an application.
You route the connected application for review, which locks the budget from editing.
OSP approves the connected application, which makes the budget editable again.
You disconnect the budget from an application.
Award Setup Requests (ASR)
You route the associated Award Setup Request for approval.
You upgrade a legacy budget.
Note: Snapshots from converted legacy budgets are also displayed in the table.
If your budget list has no items, a piggy bank image displays with the text “Start your first budget! SAGE Budget helps you glide through the process of preparing accurate budgets that comply with complicated sponsor guidelines.” Use the New Budget button below the piggy bank image to create a budget.
Create a New Budget
To create a budget, select the New Budget button on the upper left. The following image shows the button:
Your new budget will open and display the Budget Settings section for adding periods. Once you add a Budget Start Date, you can begin entering costs or move to any other part of the budget.
View Your List of Existing Budgets
Your budget list includes any budget that you have permission to edit or to view. The following information is displayed for each budget on your list:
Title – the title of your budget; click on the title to open your budget in the same tab or or select the arrow icon to open in a new browser tab.
Principal Investigator – the first and last name of the person designated as the PI on the budget’s primary worksheet
Budget Number – the unique, system-generated number for your budget
Active Linked Application – the most recently linked application for this budget, if there is one; click the link to open the application in a new tab
Last Edited – the date this budget was last edited, and the person who did the editing
Created Date – the date this budget was created
The budgets are in order by the Last Edited date, with the most recently edited one at the top. The following image shows an example budget list.
By default, there are 10 budgets listed on the page. The pagination tool at the bottom right of the list allows you to set the number of budgets shown on the page to 10, 25, or 50. When you change the number per page, the list will re-display from the top.
When you have more budgets than can display on a page, you can click on the arrows to move up or down the list. As you move through the list you will see an indication of where you are. For example, 26-50 of 221 indicates 25 budgets display on a page, and that you are on the second page of a list with a total of 221 budgets. The following image display this example.
Search for an Existing Budget
To quickly find a budget, you can use the type-ahead search feature at the top, right of the page.
Click in the box and enter a search term. You can search by budget title, number, or the Principal Investigator’s name. When you pause in typing, a results list will appear. Click on an item in the list to open that budget. Changing the text in the search box will start a new search.
The following image shows a search term and results list.
Note: Upgraded Legacy Budgets
On January 28, 2022, budgets in the legacy format were upgraded to the current format. Review the Automatically Upgraded Legacy Budgets article for complete details.
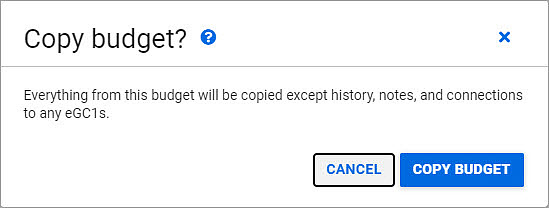
You can copy an existing budget to create a new one. At the far right of the budget header, select the “more options” menu icon (three blue vertical dots). Choose the Copy Budget option from the menu. A confirmation dialog will appear, stating that “Everything from this budget will be copied except history, notes, and connections to any eGC1s.” The following image shows this dialog.
When you confirm Copy Budget, your new budget will be created and you will see it in a new tab/window. The budget you copied will continue to display in its own tab/window.
You can copy any budget that you have edit or view-only access to.
Delete an Existing Budget
Note: Deleting a budget is permanent.
You can delete a budget that you can edit, unless it is connected to an eGC1, an Award Setup Request, or an Award Modification.
At the far right of the budget header, select the “more options” menu icon, three blue vertical dots. Choose the Delete Budget option from the menu. A confirmation dialog will appear, stating “This entire budget will be permanently deleted.” The following image shows this dialog.
When you confirm the deletion, your budget list will display, and the deleted budget will no longer appear on the list.
SAGE Budget enables you to create accurate, detailed budgets for your grant and contract proposals, and for your award and modification requests. The comprehensive budget minimizes errors and improves data quality.
It’s simple. Select a start date, and begin entering costs.
It’s accurate. SAGE Budget automatically populates your budget with real-time salary and benefits information, calculates budget totals for each period, and identifies the correct F&A rate.
It’s efficient. It applies inflation rates for Salary, Tuition, and other line items across budget periods. It can cascade entries on non-salary line items, so the values you enter in one budget period are automatically propagated to subsequent budget periods.
It’s flexible. With the click of a button, you can copy a budget and reuse it as a template for future budgets.
It’s tailored for the UW Research Community. SAGE Budget is customized to comply with UW Accounting Rules, so you needn’t memorize object codes or look up the latest F&A rates.
It’s convenient. Connect your budget to an eGC1 or award request, and they will route together so reviewers can easily see budget details in a standard format.
It’s a time saver. If you are creating a Grant Runner application and using the RR Detailed Budget, connecting your budget to your application will automatically populate the form.
When you might not want to use SAGE Budget
Currently SAGE Budget does not fully support CTO (CRBB) budgets.
Additional Information
For more information on preparing a budget, review the Office of Sponsored Program’s Budget Development page.
Departmental ASTRA Authorizers provide access to the SAGE system. The Accessing SAGE page provides more details.
You can enter your budget figures on the eGC1 Budget page or connect a budget created in SAGE Budget. The advantages of building a budget in SAGE Budget and then connecting it to your eGC1 are that you can easily access current salary information and F&A rates, track different versions of your budget, and reduce duplicate data entry from SAGE Budget. See Connect Budget for more details.
If you choose to enter your budget information manually into the eGC1 Budget page, be sure to do the following:
Specify the appropriate UW Financial Accounting System (FAS) Object Code for each of your expenditures. The UW object codes may be different from the sponsor’s budget categories, so a conversion between the categories may be necessary. See the financial system Object Codes for more details.
Include each budget item only once to ensure that SAGE does not count them twice in those totals which are automatically calculated.
Enter the direct costs for the first budget period (e.g., year 1) and the direct costs for the total of all budget periods. For single-year budgets, entering data in the “1st Period” column is optional.
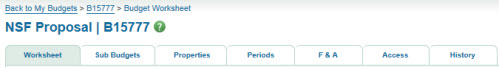
The budget worksheet displays line items and period totals for each budget line. The name of the budget and its reference number display above the worksheet navigation tabs.
Tabs
Worksheet: Displays the Budget Worksheet page
Sub Budgets: Displays the Sub Budgets page
Properties: Displays the page with the Budget Properties, Global Attributes and Advanced Settings sections (step 1 of the budget creation wizard)
Periods: Displays the page with the Periods sections (step 2 of the creation wizard)
F&A: Displays the page with the Funding Details and F&A Rates and Base sections (step 3 of the creation wizard)
Assign Access: Displays the page with the Contacts and Access sections (step 4 of the creation wizard)
Targets & Limits: Displays the page with the Targets & Limits Settings; this tab only appears if you chose this option on the Properties page. It would be step 5 of the creation wizard.
History: Displays the page with the Budget History; if you linked an eGC1 to the budget, information about it would also appear here.
Worksheet Icons on the Action Bar
At the upper right area of the worksheet is a set of icons. Placing your mouse pointer over an icon will display its function. For full details on each of these icons, see the Worksheet Actions article.
Worksheet Details Overview
Click on any object code summary line to display any existing sub-object line items.
The column entry for one period, for a specific sub-object code line item, shows the total calculated in the item-entry screen(s). The column entry for one period, for an object code summary line, shows the total of all its sub-object code line items for that period. An entry in the “Summary ($)” column (at the far right), for an object code summary line, shows the total of all the periods for that line. At the bottom of the worksheet are column totals for several categories of costs.
In the Salary and Wages section, added personnel will have corresponding entries in the Retirement and Benefits section. Student Aid line items are automatically added when you add an individual to the Salaries and Wages section with a UW sub-object code of: 01-33, 01-34, 01-43, 01-44, 01-51 to 01-54, or 01-91 to 01-94.
Worksheet Table Columns
Description column
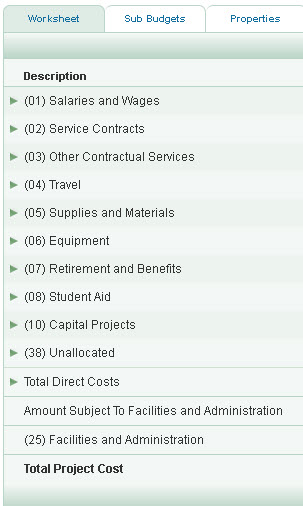
This lists the budget lines, which are categorized into 11 summary sections, derived from actual UW Object Codes. Click on a summary line to display its sub-object codes, or hide them. The current object codes included are:
(01) Salaries and Wages
(02) Service Contracts
(03) Other Contractual Services
(04) Travel
(05) Supplies and Materials
(06) Equipment
(07) Retirement and Benefits
(08) Student Aid
(10) Capital Projects
(38) Unallocated
(19) APL
Note: SAGE Budget does not include all UW Object Codes.
Target Amount
This line displays only when you have the Targets and Limits feature enabled. It displays the target amount you have established for each period of your budget. This amount is not included in your budget totals.
Target Difference
This line displays only when you have the Targets & Limits feature enabled. The Target Difference is the difference between the target amount you have established for each period of your budget and your budget total. When your budget exceeds the target amount, the target difference displays in red text. When your budget is less than your target amount, the target difference displays in black text.
The Target Difference is not included in your budget totals.
Summary and period columns
The summary column values are the sum of all line items (sub-object codes) set up within the summary line’s section.
Each budget column represents one period. The periods are defined in step 2 of the setup.
Each person added is a row in the table for this section. The last row is the Salary & Benefit Costs Total which displays the calculated total for each period and the All Periods column.
Note: Award requirement: Workday requires one Project Role of Principal Investigator with or without a Percent Effort even if there is a secondary PI (Application PI, Multiple PI, or Co-Investigator.)
This requirement applies to the Primary, Internal, and Fabrication worksheets.
The following image shows an example of this section:
The column headings for personnel are:
Name
Project Role
Period description, with the period dates
All Periods
Adding Personnel
You can add either UW Personnel or Placeholder (TBD – to be determined) personnel to your budget. Placeholder (TBD) personnel can be used, for example, to add some personnel roles to your budget when you do not yet know specifically who the person will be.
To add personnel, click on the Add Personnel Cost drop-down menu to the right of the section title. Then select either Search for UW Personnel or Add Placeholder Personnel. The following image shows the expanded drop-down menu.
Adding UW Personnel
When you select Search for UW Personnel, the system adds a row at the top of this section, and puts the cursor in the Name field. As indicated by the hint text, you can search by name or NetID. As you type in characters, the system will start displaying matching results. As you add more characters, the results list will continue to update.
The results list shows the person’s first and last name, their title and department. From the results list, click on the person you want to add to your budget. Their first and last name will display in the Name field.
The following image shows an example of a search and results list.
Use the Project Role drop-down menu to indicate their relationship to the project. Choices are:
Principal Investigator – only one personnel entry on a worksheet can have this role
Application PI
Multiple PI
Mentor
Co-Investigator
Faculty
Key Personnel
Post Doctoral Associate
Graduate Student
Research Scientist
Undergraduate Student
Secretarial/Clerical
Other
As you add personnel, each new person displays in the top row, so that the column headers are visible. A Sort by Role link displays above the All Periods column. When active, clicking it will rearrange the list of personnel to match the order in the drop-down. It will only be active when the list is not in order.
Adding Placeholder Personnel
When you select Add Placeholder Personnel, the system adds a row at the top of the section with TBD in the Name column. You can use the name side panel, described below, to adjust the name for a placeholder (TBD) entry. Use the drop-down menu in the Project Role column to indicate this person’s relationship to the project. You can use a TBD entry for the PI on subaward worksheets.
Personnel Details
There are two side panels with additional details for personnel. You can close either panel by clicking on the blue X to the right of the panel name, or by clicking somewhere outside of the panel.
Personnel Details Panel
Access this panel by clicking in the Name field. For UW Personnel, it displays the person’s preferred name and title. You can edit the title and add an optional Prefix or Suffix.
For placeholder personnel, you can edit the First Name, Middle Name, and Last Name fields in addition to Title, Prefix, and Suffix. The following image shows the personnel details panel for a placeholder personnel.
Personnel Period Panel
Access this panel by clicking in a period field for an individual. It allows you to view and adjust salary, effort, and benefits details used to calculate the cost for this person.
The panel header includes:
The period description
The period total dollar amount, which is equal to the Total Requested Salary plus Total Benefits on Salary
If Sea Pay is enabled, the total will also include the Total Sea Pay and Total Benefits on Sea Pay
Information text indicating the current cascading state (on or off)
The blue X, to the right of the period description, which will close the panel
The following image shows the panel header and salary area.
Salary Details
Monthly Base Salary
For UW Personnel, this value comes from Workday. Below this field, there is a link to View Salary Details. When clicked, it opens a dialog showing additional details about the person’s compensation. The dialog is described below. Within the field is a Refresh icon (two curved arrows). Clicking this will open a confirmation dialog stating “Refreshing this salary will replace the current salary with the most up-to-date value for person’s name. Custom allocations you have added will be overridden.” You can continue or cancel from the dialog.
For Placeholder Personnel, the Monthly Base Salary is a default value of $0. Enter the appropriate amount for this period.
For Hourly Wage Personnel, review the Adding Hourly Personnel article for step-by-step instructions.
Inflation Rate
For a newly created budget and primary worksheet, the current default value is 2%.
A newly created sub-budget worksheet will use the value from the Budget Settings.
Adjusted Monthly Base Salary
This is a system calculated field.
It is equal to the Monthly Base Salary adjusted for inflation.
View Salary Details
Clicking this link in the Period panel will open a dialog displaying the person’s Monthly Base Salary Details.
The person’s name and selected budget role are listed, along with their UW Monthly Salary and the date it was retrieved from the payroll system. A table includes one row for each allocation. The columns are:
Sub-Object Code
Position Title
Cost Center
Organization
Compensation Plan
Unallocated Rate
Distribution Percentage
Full-Time Rate
A detailed row in the column displays for each compensation plan amount and allocation combination. Some compensation plans have a single cost center allocation, some have many.
If no allocation record exists for general salary or hourly plan, then the position’s FTE is used as the distribution percent and the position cost center is displayed.
If allocation record(s) exist for general salary or hourly plan, then the allocation distribution percent and cost center are displayed.
All allowance pay has a distribution percent of 100% (1.0).
All stipend pay has a distribution percent of 100% (1.0) and the positions cost center is displayed.
Each table row has a check box to the far left, including the column heading row. By default, all allocation rows are checked with the exception of administrative and endowed supplements. You can adjust what allocations are included by using the check boxes. Unchecking the box on the header row clears all the boxes.
Note: Review more guidance on effort reporting in GIM 35 and Post Award Fiscal Compliance Guidance on Effort Compliance Topics.
Below the table there are three values:
Selected Allocations Total
UW Clinical Salary Total
Starting Monthly Salary – the sum of the first two values
Effort Details
The following image show the panel effort area.
Calendar or Academic/Summer
The default value is Calendar for all personnel.
If you select Academic/Summer, two fields will display for effort values.
Months or Academic/Summer Months
For calendar, the default value for Months is the length of the period
For academic/summer, the default values are 75% and 25% of the length of the period, respectively. The fields are editable, so you can reduce these assumed values, if needed. You cannot exceed the default percent.
Percent Effort or Academic/Summer Percent Effort
The default value is 0%.
Enter the amount of effort for this person, and the system will calculate the Monthly Hours.
The calculated value is equal to the Monthly Hours/ 173.3 * 100. There are 173.3 hours in a standard month.
Note: This field and the Monthly Hours field are connected. If you enter a value in one, the system will calculate the value for the other. This lets you choose which value you want to enter.
Monthly Hours or Academic/Summer Monthly Hours
The default value is 0.
Enter the number of hours for this person for this period to have the system calculate the Percent Effort.
The calculated value is equal to the Percent Effort / 100 * 173.3 There are 173.3 hours in a standard month.
Person Months
This is a system calculated field.
The value is equal to the Percent Effort * Months
Total Requested Salary
This is a system calculated field.
The value is equal to the Adjusted Monthly Base Salary * Percent Effort
For UW Personnel, their sub-object code from Workday displays.
For Placeholder Personnel, use the drop-down menu to select the appropriate sub-object code.
Note: for sub-object codes in the 30, 40, 50, or 90 range, the system will automatically add a tuition entry in the Other Costs section of your worksheet for the individual. See the Linked Tuition Entries section below for full details.
APL Benefit Rates Option
If you enabled APL in the worksheet settings, two options will display: Standard Benefits and APL Benefits. By default, the Standard Benefits option is selected. To use the APL Benefits option, click on its tab.
Two rate fields will display, APL Benefit Rate and APL Leave Rate, with the corresponding rates for the sub-object code selected. Both rates are editable.
A link to Refresh Benefit & Leave Rates displays below the option tabs.
Selecting the Standard Benefits tab will remove the APL fields and re-display the standard rate.
Benefit Rate
The corresponding rate for the sub-object code selected displays.
You can enter a different value, if needed.
Within the field is a Refresh icon (two curved arrows). Clicking this will open a confirmation dialog stating “Refreshing the benefit rates will replace the current benefit rates with the most up-to-date values for person’s name.” You can continue or cancel from the dialog.
Total Benefits on Salary
This is a calculated field.
The value is equal to Total Requested Salary * Benefit Rate.
If using APL benefits, the value is the sum of (APL Benefit Rate * Total Requested Salary) + (APL Leave Rate * Total Requested Salary).
Sea Pay
If you have enabled Sea Pay in the worksheet setting, additional sea pay fields will display below the Total Benefits on Salary amount, as shown in the following image.
Hours of Sea Pay – enter the hours for the period
Sea Pay Hourly Rate – calculated amount equal to the Adjusted Monthly Base Salary divided by 173.3 (work hours in a standard month)
Total Sea Pay – calculated amount equal to Hours of Sea Pay times Sea Pay Hourly Rate
Sea Pay Benefit Rate – defaults to the rate for 01-86 Hourly personnel; if APL benefits are being used, this rate is the 01-86 Hourly APL benefit rate. You can edit this field. The field also includes a refresh link.
Total Benefits on Sea Pay – calculated amount equal to Total Sea Pay times Sea Pay Benefit Rate
To the right of the All Periods column is a “more actions” menu icon. The icon is 3 blue vertical dots. When you click on the icon, the menu displays.
It includes the choice the turn cascading on or off for this specific entry. When turned on, any values changed or entered in a period will cascade to future periods.
Deleting Personnel
Open the “more actions” menu icon to the right of the All Periods column. When you select “Delete Personnel” a confirmation dialog appears, stating “Are you sure you want to delete this cost? This action is permanent and cannot be reversed.” You can cancel or confirm the deletion of the personnel entry.
Adding Entry Notes
There are choices for managing notes on the “more actions” menu, which vary depending on the whether a note exists:
Add Note – if none exists
Edit Note – if there is an existing note
Delete Note – if there is an existing note
When you select Add Note, a dialog will display with the person’s name and role. Use the text box for entering your note. Click Save to complete the process. You can also cancel out of the dialog, without saving a note. The following image shows the note dialog.
When a note is added, a “sheet of paper” icon will appear following the person’s name. Place your mouse over the icon to read the note.
If a note is present, the menu will include Edit Note and Delete Note. If you select Edit Note, the same dialog will appear. You can edit the current note, and then save the updated text. If you cancel, the original note remains.
If you select Delete Note, the note and note icon are both removed.
Linked Tuition Entries
When you add a personnel cost with a tuition-eligible sub-object code (30s, 40s, 50s, or 90s), the system will automatically add a linked tuition line item (08-05) to the Other Costs table, and a brief note to that effect will display.
A small gray oval with a university icon will display in the Name column for that personnel entry. When you hover your mouse over it, the text “This personnel cost has a linked tuition cost” will display. Correspondingly, the tuition entry will have a read-only description of “Tuition for first-name last-name” followed by a link icon. When you hover your mouse over the icon, the text “This tuition cost has a linked personnel cost” will display.
In the Personnel side panel, two additional items will display. A toggle switch to “Include linked tuition cost”, followed by an “Edit Period X Tuition” link button. The toggle switch is on by default. If you turn the toggle off, a confirmation warning will display. If you confirm the change, the linked tuition line will be deleted. The personnel line item icon will change to an orange warning icon, and the option to “Edit Period X Tuition Cost” will be removed from the side panel. Hovering over the orange icon will display the text “Personnel with this sub-object code usually have a linked tuition cost”.
When the toggle switch for “Include linked tuition cost” is off, the warning of “Personnel with this sub-object code usually have a linked tuition cost” will display below it. Switching it back on will re-create the linked tuition entry.
When you change the sub-object code for a personnel line to one that is tuition-ineligible, then a confirmation modal displays. It clarifies that the change will delete the linked tuition line item. When you confirm the change, the system updates the personnel sub-object code and deletes the tuition line item.
If you select “Edit Period X Tuition” in the personnel side panel, the system will redirect you to the tuition entry for that person, for that period, and its side panel will display.
In the linked Tuition side panel, selecting the “Edit Period X Salary & Benefits” link button will redirect you to the personnel entry for that person, for that period, and its side panel will display.
The “more options” icon at the right of a linked tuition line includes an option to delete the line item. Selecting it will display a confirmation modal, and continuing will delete the tuition line item. The formerly linked personnel line item remains.
This article describes the Budget Settings—these settings affect the budget as a whole. The Worksheet Settings article describes the settings that only affect a particular worksheet.
On the lower section of the left navigation menu, select the gear icon or “Budget Settings” to display the settings page.
There are five subsections for settings. Each section can be expanded or collapsed by selecting the section name and description. Once expanded, you will see a Close link in the lower left. Also a Previous Section and/or Next Section link will display in the lower right.
The following image shows the Budget Settings with all sections collapsed.
The sections are:
Budget Title & Periods – Add a title and establish dates for each time period
Spending Targets – Benchmark a spending goal for each period
Salary Cap – Set a maximum annual salary
Data & Calculations – Set up rounding, cascading, and default inflation rates
Access & Roles – Assign roles and grant contacts access to a budget
Budget Title & Periods
The Budget Title defaults to “New Budget” when you create a budget. You can then edit the title, entering up to a maximum of 300 characters. A Budget Title is required. Below the Budget Title you will see a hint that shows the number of characters used, for example, 10/300, as shown in the following image.
Based on the width of your computer screen, the full Budget Title may not show in the header, but instead display with an ellipsis (…); you can see the full title by hovering over it, as shown in the following image.
Periods
This section establishes the start and end dates for each budget period. You need to have at least a Budget Start Date before adding any costs.
There are two period options: Equal Length Periods and Varied Length Periods. By default, the Equal Length option initially displays. To select the Varied Length option, select it from its tab.
Note: when you create a new budget, it will open to this section so that you can add your Budget Start Date.
Period Descriptions
The default Descriptions for the periods are Period 1, Period 2, and so forth. You can edit a description, entering up to 100 characters. A value is required for every period description.
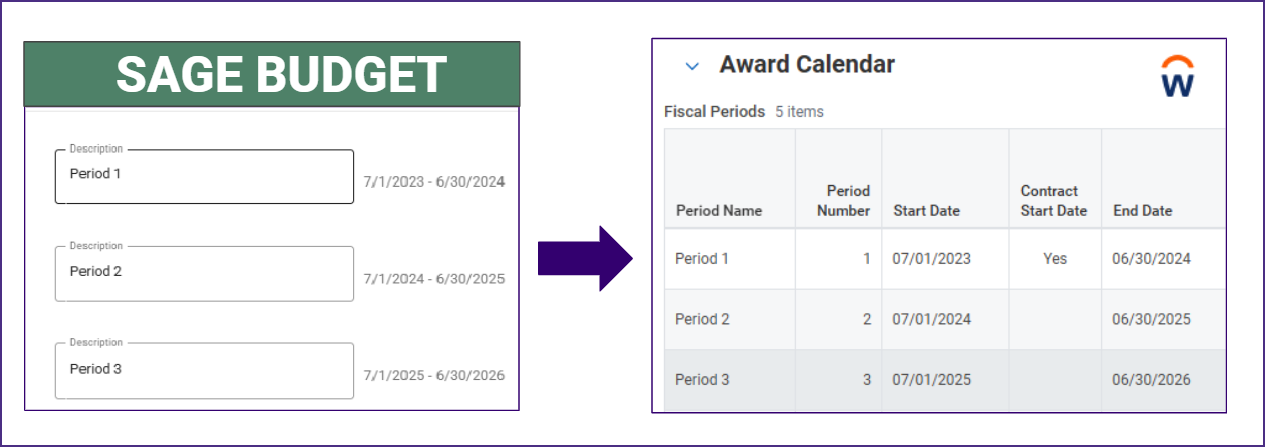
Period Descriptions in SAGE Budget are used as the Period Name in Workday’s Award Calendar. When creating a MOD budget, it is important that you align SAGE Budget period names with currently existing Workday period names. This will help accurately communicate which period is being modified or newly set up. Using inaccurate period names (e.g., renewal Period 2 is named Period 1 in SAGE Budget) may cause returns that delay processing.
When submitting a MOD for a new period on an existing award, update the default “Period 1” name in SAGE Budget to reflect the period your new budget applies to. It must not be the same as another period name already being used on that award.
Example Naming Issue & Fix
Issue: For MOD budgets, budget preparers are sometimes creating a new SAGE budget for renewal years, but not updating period descriptions to reflect the correct period/year. For example, the defaulted name of Period 1 is kept, even though it is actually Period 2 being set up. Since Period 1 already exists in Workday, this will cause a conflict at time of integration.
Fix: Update your period descriptions in SAGE Budget to align with the correct and accurate period being modified or set up in Workday. (Do not re-use Period 1 for renewal periods.)
Equal Length Periods
The following image shows equal length periods:
Use this choice to easily set up a number of periods of the same length. Add a date in the Budget Start Date field. By default, the Total Number of Periods value is set to one (1), and the Length of Each Period (Months) is set to 12.
Once you add a start date, a list of periods will appear below the period length field. It displays the period description and its start and end dates. As you change any of the variables, the list will automatically update to reflect your changes.
To change the Total Number of Periods, use its drop-down menu. It contains the values one through ten, and a Custom option. For example, if you select five periods, the system will generate the start and end dates for all of the periods, based on the Budget Start Date you entered and the period length.
Use the Length of Each Period (Months) field to change the value from the default of 12. Once you click out of the field, the system will update the period dates to adjust for the new period length. The period length is in months and therefore must be an integer number.
Note: The date ranges for periods must be contiguous; no gaps in time between periods are allowed. The system will enforce this.
The default Descriptions for the periods are Period 1, Period 2, and so forth. You can edit a description, entering up to 100 characters. A value is required for every period description.
Varied Length
Choose this option if you know your budget has periods of unequal length.
The following image shows this option.
The first editable field is the Description. The default Descriptions are Period 1, Period 2, and so forth. You can edit a description, entering up to 100 characters. A value is required for every period description.
Enter a Start Date for the first period. By default, the system will add an End Date to make the period 12 months in length. Edit the End Date as needed. The system will recalculate the length in months.
Use the Add Period link below the Period Description field to generate another period with the same length as the prior one.
As needed, adjust the end dates of existing periods, and use the Add Period link to define all of your budget’s periods.
For periods other than the first one, you can only change the end date values. The system will ensure that each End Date is greater than its period Start Date. As you change end dates, the system will adjust the dates for any future periods already created.
Switching Between Period Options
If you have set a start date and added periods using either the equal or varied length option, and then switch to the other option, the system will use the start date, the number of periods, and the length of the first period to calculate new end dates as needed.
Updating Periods
To update a period, select the calendar icon in the Budget Start Date field and change the date. If you are using Varied Length Periods, use the calendar icon to edit the Start and End Dates.
Note: Occasionally, dates don’t set correctly if you are working outside of the Pacific time zone. If you are in another time zone and are encountering trouble setting dates correctly, please email SAGE help at sagehelp@uw.edu.
Deleting Periods
You have the option to delete either the first or last period from a budget. When you delete the first period, the new budget start date will be that of the original period 2. If you delete the last period, then the final budget end date will be that of the now last period.
Note: When you delete periods, the remaining period descriptions are not changed.
Spending Targets
This section allows you to set a spending target for each period and select the value you want to target.
Click on the toggle switch to Enable Targets and Limits. You will then see additional fields for setting up your targets.
You have two options for setting your target amounts: Equal Spending Targets and Varied Spending Targets. With equal targets, the same amount is applied to every period. With varied targets, you can apply different amounts to individual periods.
The following image shows the default Equal Spending Targets option:
Select the varied tab to change options.
For Equal Spending Targets, enter your dollar amount in the Spending Target Amount (Per Period) field.
For Varied Spending Targets, enter a dollar amount in the field for each period.
The following image shows an example of Varied Spending Targets.
Next select which budget total you want to target. The choices are:
Total Direct Costs
Total Direct Costs less Subrecipient F&A
Total Project Costs
The corresponding total in the Budget Header will display an arrow following its value. The arrow will be black and pointing down if your total is below the target. The arrow will be red and pointing up if your total exceeds the target. You can select the value in the header to see period details, and optionally, edit the spending target values.
The following image shows the period details.
Salary Cap
This section allows you to set a maximum annual salary cap when your sponsor requires one. By default, this option is not selected.
Click on the toggle switch to Enable Salary Cap. You will then see additional fields.
For the Salary Cap Amount field, enter the value your sponsor requires. By default, the initial value is zero.
The Salary Cap Note is optional. If you enter a note, you will see it on some exports of your budget.
The following image shows this section.
On your budget worksheets, you will see a “cap” indicator following the name of any personnel whose salary is capped. When you hover over the indicator, you will see the text “This salary is calculated using the annual salary cap of $###,###.”
When you select the person’s dollar amount for any period, you will see the details in the side panel. Both their total pre-capped salary and the total capped salary display. The total capped salary for a period is the cap amount times the person’s percent effort.
This section allows you to set choices for benefit rates, salaries, rounding, cascading, and inflation rates. The following image shows the benefit, salary, and rounding areas in this section.
Benefit Rates
You have a choice of using preliminary benefit rates for the next fiscal year when they are available, or of always using only the current rates. By default, the Preliminary option is selected. Note that some sponsors will only accept current, published benefit rates.
Preliminary benefit rates are the anticipated values for the coming fiscal year. They are generally available in SAGE Budget in late spring for future budgeting. The system uses preliminary benefit rates in a budget period only if that period starts on or after July 1. That is, the period’s start date must be in the same fiscal year as that of the preliminary benefit rates, or in a future fiscal year.
Note: Benefit rates used for any individual are editable.
Refresh Benefit Rates and Refresh Salary
You have the option to refresh the benefit rate and/or salary amount for all UW Personnel on your worksheets, other than subawards.
Doing a refresh will replace the benefit rate and/or salary amount, including any customized values, with current values from Workday.
When you select refresh, you will see a confirmation dialog. You can cancel or continue with the refresh.
Round Currency Expenses
There are three options for rounding currency (dollar) amounts for display: To Whole Dollar, To Cents, and Do Not Round. By default, the To Whole Dollar option is selected.
If you select either To Whole Dollar or To Cents, the period amount for each cost is rounded as are the totals for each period and the All Periods amounts. The Price amount for entries in the Other Cost section is never rounded.
For the To Whole Dollar choice, no decimal places display. For the To Cents choice, two decimal places display.
When you select Do Not Round, the Decimal Display for Dollar Amounts field appears. Edit the number of decimal places you want to see displayed. Note that if the previous selection was To Whole Dollar, the default value will be zero (0); if To Cents, the default value will be two (2).
Cascade Other Cost Entries
The following image shows the Cascade Other Cost Entries and the Inflation Rate areas in this section.
Click on the toggle switch to enable the Cascade Other Cost Entries option for the entire budget. You can override this setting for any specific worksheet or individual cost. By default, this option is not selected.
Inflation Rates
There are three inflation rates used in your budget: Salary, Tuition, and General. The default values are 2% for Salary, 3% for Tuition, and 0% for all other costs. You can edit these rates for the whole budget, a specific worksheet, or an individual cost.
Access & Roles
The Access & Roles section allows you to manage who has access to your budget, and what level of access. The following image shows this section with some example data:
The first three rows of the access table are for the Award Preparer, Budget Preparer, and Pre-Award Budget Contact. The Budget Preparer is auto-populated with the name of the person who created the budget. Providing the Pre-Award Budget Contact and Administrative Contact is optional, but it is strongly encouraged you do so.
To add a contact, start typing in the Contact column of the table to search by name or NetID. When you select a person, their organization, email and phone information will display.
To provide others access to your budget, use the Add General Collaborator link, above the table. Selecting the link will add a General Collaborator row to the table. Start typing in the first column to search for the person by name or NetID. Then use the drop-down menu in the Permissions column to give them View Only or Can Edit access. You can change the access permission at any time.
To change or remove contacts or collaborators, select the “more options” menu icon to the far right (three vertical blue dots).
The Admin and Budget Contacts can be demoted to a General Collaborator with edit permission or removed from the budget entirely.
General Collaborators can be promoted to be the Preparer or a Contact, or removed from the budget entirely.
If the contact role is empty, the collaborator is automatically promoted to the contact role.
If the contact role is not empty, or the change is to the Preparer, a confirmation dialog appears to confirm the replacement. The person being replaced is demoted to a General Collaborator with edit permission.
If you try to add an already-listed person directly, their name will appear grayed out in the search results.
The following images show the “more options” menus for both contacts and collaborators.
Permissions on a Copied Budget
If the person who is making the copy is not the Budget Preparer on the original budget, then they will become the Budget Preparer (owner) on the new budget, and the original preparer will become a General Collaborator with Can Edit access.
Permissions on Budgets Connected to eGC1s, Advance Budget Requests, and Award Setup Requests
When your budget is connected to an eGC1, you will also see the eGC1 Preparer and the eGC1’s PI listed as owners. If the eGC1 has a related Advance Budget Request or Award Setup Request, you will also see the Advance Preparer(s) or Award Preparer and others with access to the Advance or Award. See the article about Connected SAGE Budgets and eGC1s for full details.