Lesson Nine: Settlers and Societies in California and Oregon
Census Data for Oregon and California, 1850 and 1860
Sources: The Seventh Census of the United States: 1850 (Washington, D.C., 1853);Statistics of the United States in 1860; the Eighth Census (Washington, D.C., 1866); Preliminary Report on the Eighth Census, 1860 (Washington, D.C., 1862).
| Total Population | Number of Families | |||||||
|---|---|---|---|---|---|---|---|---|
California
|
Oregon |
California |
Oregon |
|||||
1850 |
92,597 |
1850 |
13,294 |
1850 |
24,567 |
1850 |
2,374 |
|
1860 |
379,994 |
1860 |
52,465* |
1860 |
98,767 |
1860 |
11,063 |
|
*1850 population is for all of Oregon Territory. 1860 Population is for Oregon state only. |
||||||||
| Aggregates by Sex | ||||
|---|---|---|---|---|
California
|
Oregon
|
|||
Male
|
Female
|
Male
|
Female
|
|
1850
|
||||
Whites |
84,708
|
6,927
|
8,138
|
4,949
|
Fr. Colored |
872
|
90 |
120
|
87 |
Total |
85,580
|
7,017 |
8,258
|
5,036 |
% of Total |
92.4
|
7.5 |
62.1
|
37.8 |
1860 |
||||
Whites |
226,774
|
6,404 |
31,451
|
20,709 |
Fr. Colored |
1,259
|
2,827 |
76
|
52 |
Indians |
7,211
|
0,587 |
64
|
133 |
Asians |
33,149 |
1,784 |
---- |
---- |
Total |
268,393 |
111,601 |
31,591 |
20,874 |
% of Total |
70.6 |
29.3 |
60.2 |
39.7 |
Professions of Male Population |
||
|---|---|---|
California |
Oregon |
|
1850 |
||
Farmers |
1,486 |
1,702 |
Miners |
57,797 |
15 |
Total Reported |
77,631 |
3,874 |
1860 |
||
Farmers |
20,836 |
7,861 |
Miners |
82,573 |
1,793 |
Total Reported |
219,192 |
18,370 |
| Nativity (whites only) |
||||
|---|---|---|---|---|
California |
Oregon |
|||
1850 |
Male |
Female |
Male |
Female |
Born in State/Territory |
4,532 |
3,164 |
1,074 |
1,227 |
Born in United States |
59,471 |
2,395 |
6,082 |
3,554 |
Foreign Born |
20,278 |
1,351 |
800 |
159 |
Unknown |
427 |
17 |
182 |
9 |
1860 |
||||
Native Born |
153,940 |
75,891 |
27,379 |
19,840 |
Foreign Born |
116,570 |
29,507 |
4,136 |
982 |
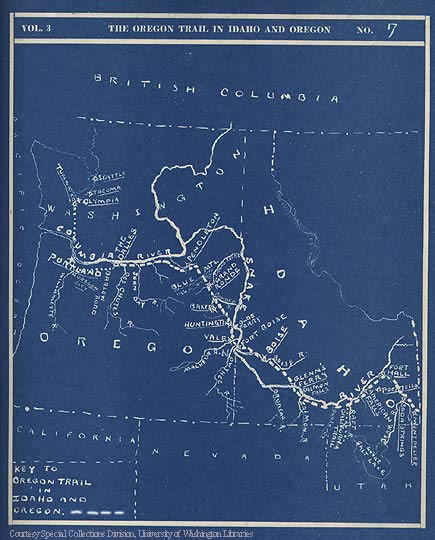
Map to a Section of the Oregon Trail, Idaho to the Pacific. (Hulburt, Archer Butler, The Crown Collection of American Maps; Series IV: The Tranconinental Trails. The A. H. Clark Company, Cleveland, 1904-1925. Vol. 3, Map 7.) |
Population By Ages: Percentage of Total Population (Whites Only) |
||||||||
|---|---|---|---|---|---|---|---|---|
California
|
Oregon
|
|||||||
1850 |
1860 |
1850 |
1860 |
|||||
Male |
Female |
Male |
Female |
Male |
Female |
Male |
Female |
|
0 to 15 |
3.4 |
2.9 |
10.9 |
10.4 |
20.2 |
19.6 |
21.9 |
20.6 |
16 to 40 |
76.4 |
3.7 |
39.5 |
12.3 |
33.0 |
14.0 |
29.4 |
14.6 |
41 to 70 |
10.7 |
0.7 |
8.4 |
2.5 |
7.5 |
3.2 |
8.2 |
4.0 |
71 to 100 |
0.09 |
0.03 |
0.1 |
0.07 |
0.1 |
0.04 |
0.2 |
0.1 |