Report from the Glacier’s Edge with UW Staff Member Tom Hammond
Tom Hammond is a technology project manager for UW-IT. He also works as a volunteer field scientist for the North Cascades Glacier Climate Project, where he studies glaciers of the North Cascades to inform climate science. He has spent over three decades exploring the North Cascades. Read on for his first-person account of a recent trip during the NCGCP 2015 field season.
The lack of winter followed by record drought and heat in the spring and summer of 2015 led to a dramatic scene unfolding across the North Cascades. We were four to six weeks ahead of schedule in everything from flowers blooming to snow melting all year. That also meant glacier ice melted at an alarming rate.
Glacier retreat in 2015 was the most extensive we have observed in a single year. Where there would normally be three meters of snow, there was none. Easton Glacier retreated 40 meters; Lower Curtis Glacier, 35 meters; Columbia Glacier, 27 meters; and Sholes Glacier, 25 meters — all records during our 32 years of observations, and each amounting to more than 10% of the total retreat in that period.
I was with Mauri Pelto, a true scientist not given to exaggeration. I say with the utmost respect and admiration for Professor Pelto that he can be a walking calculator. As we overlooked the Lower Curtis Glacier, huge portions covered with boulders, debris, and dirt, Mauri turned to me, his voice cracking with emotion and said, “This is a catastrophe. I never thought things could change so much in one year. Gradual change year after year softens the effect … catastrophic.” He mentioned that he had had similar experiences and emotions on the Columbia and Sholes Glaciers this year.
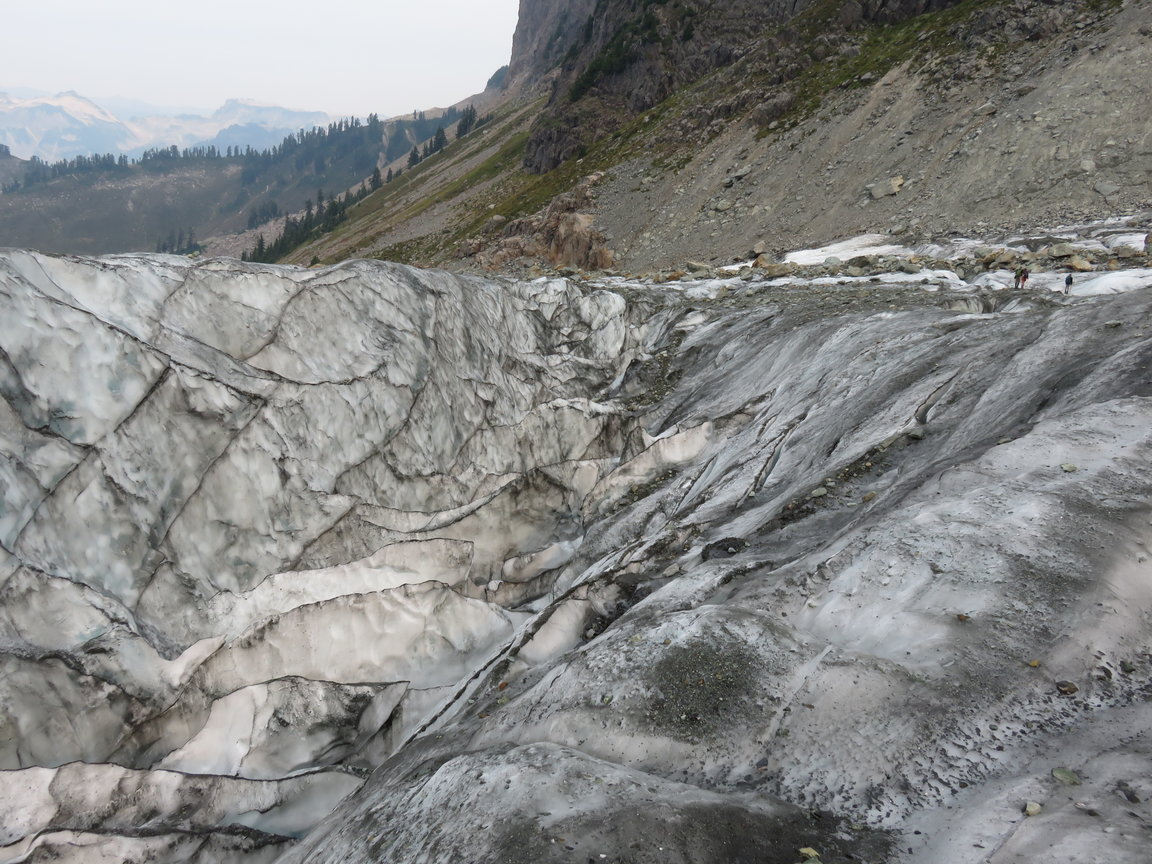
Note team members on right side of image. Crevasses merge to form huge canyons, the result of excessive melting of the glacier.
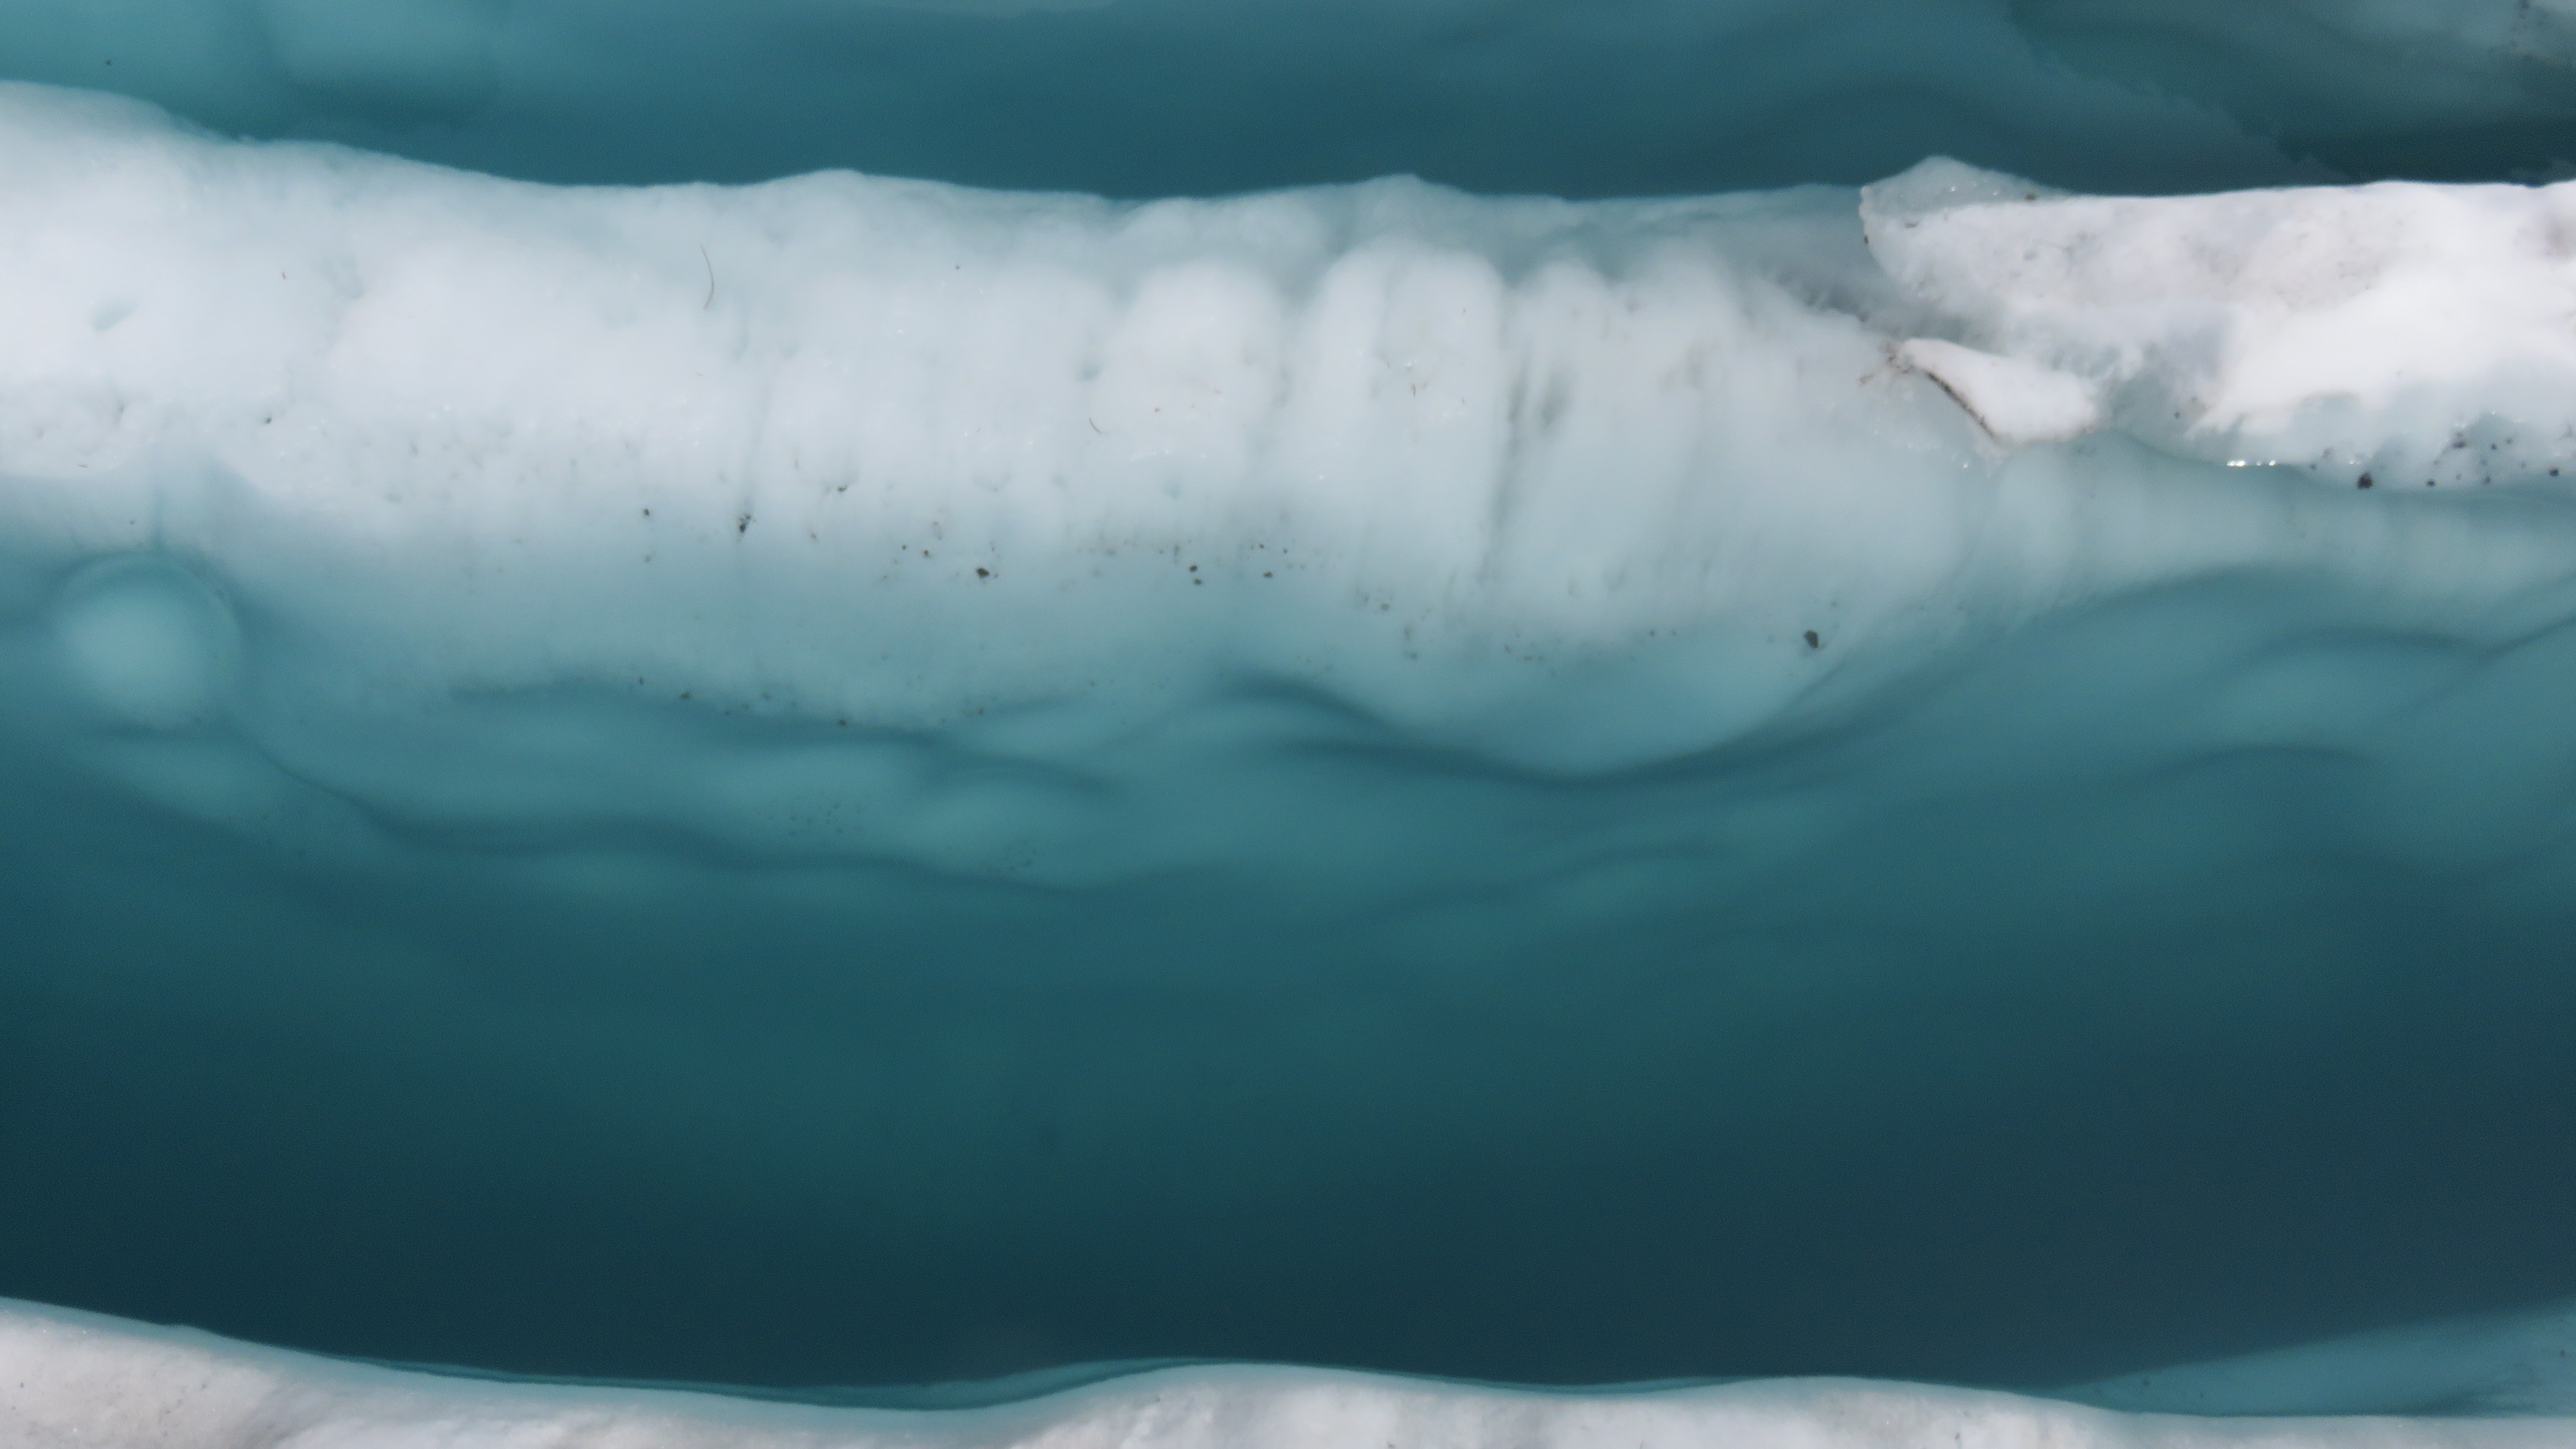
Water filled crevasses were found in many places on/in the glacier.
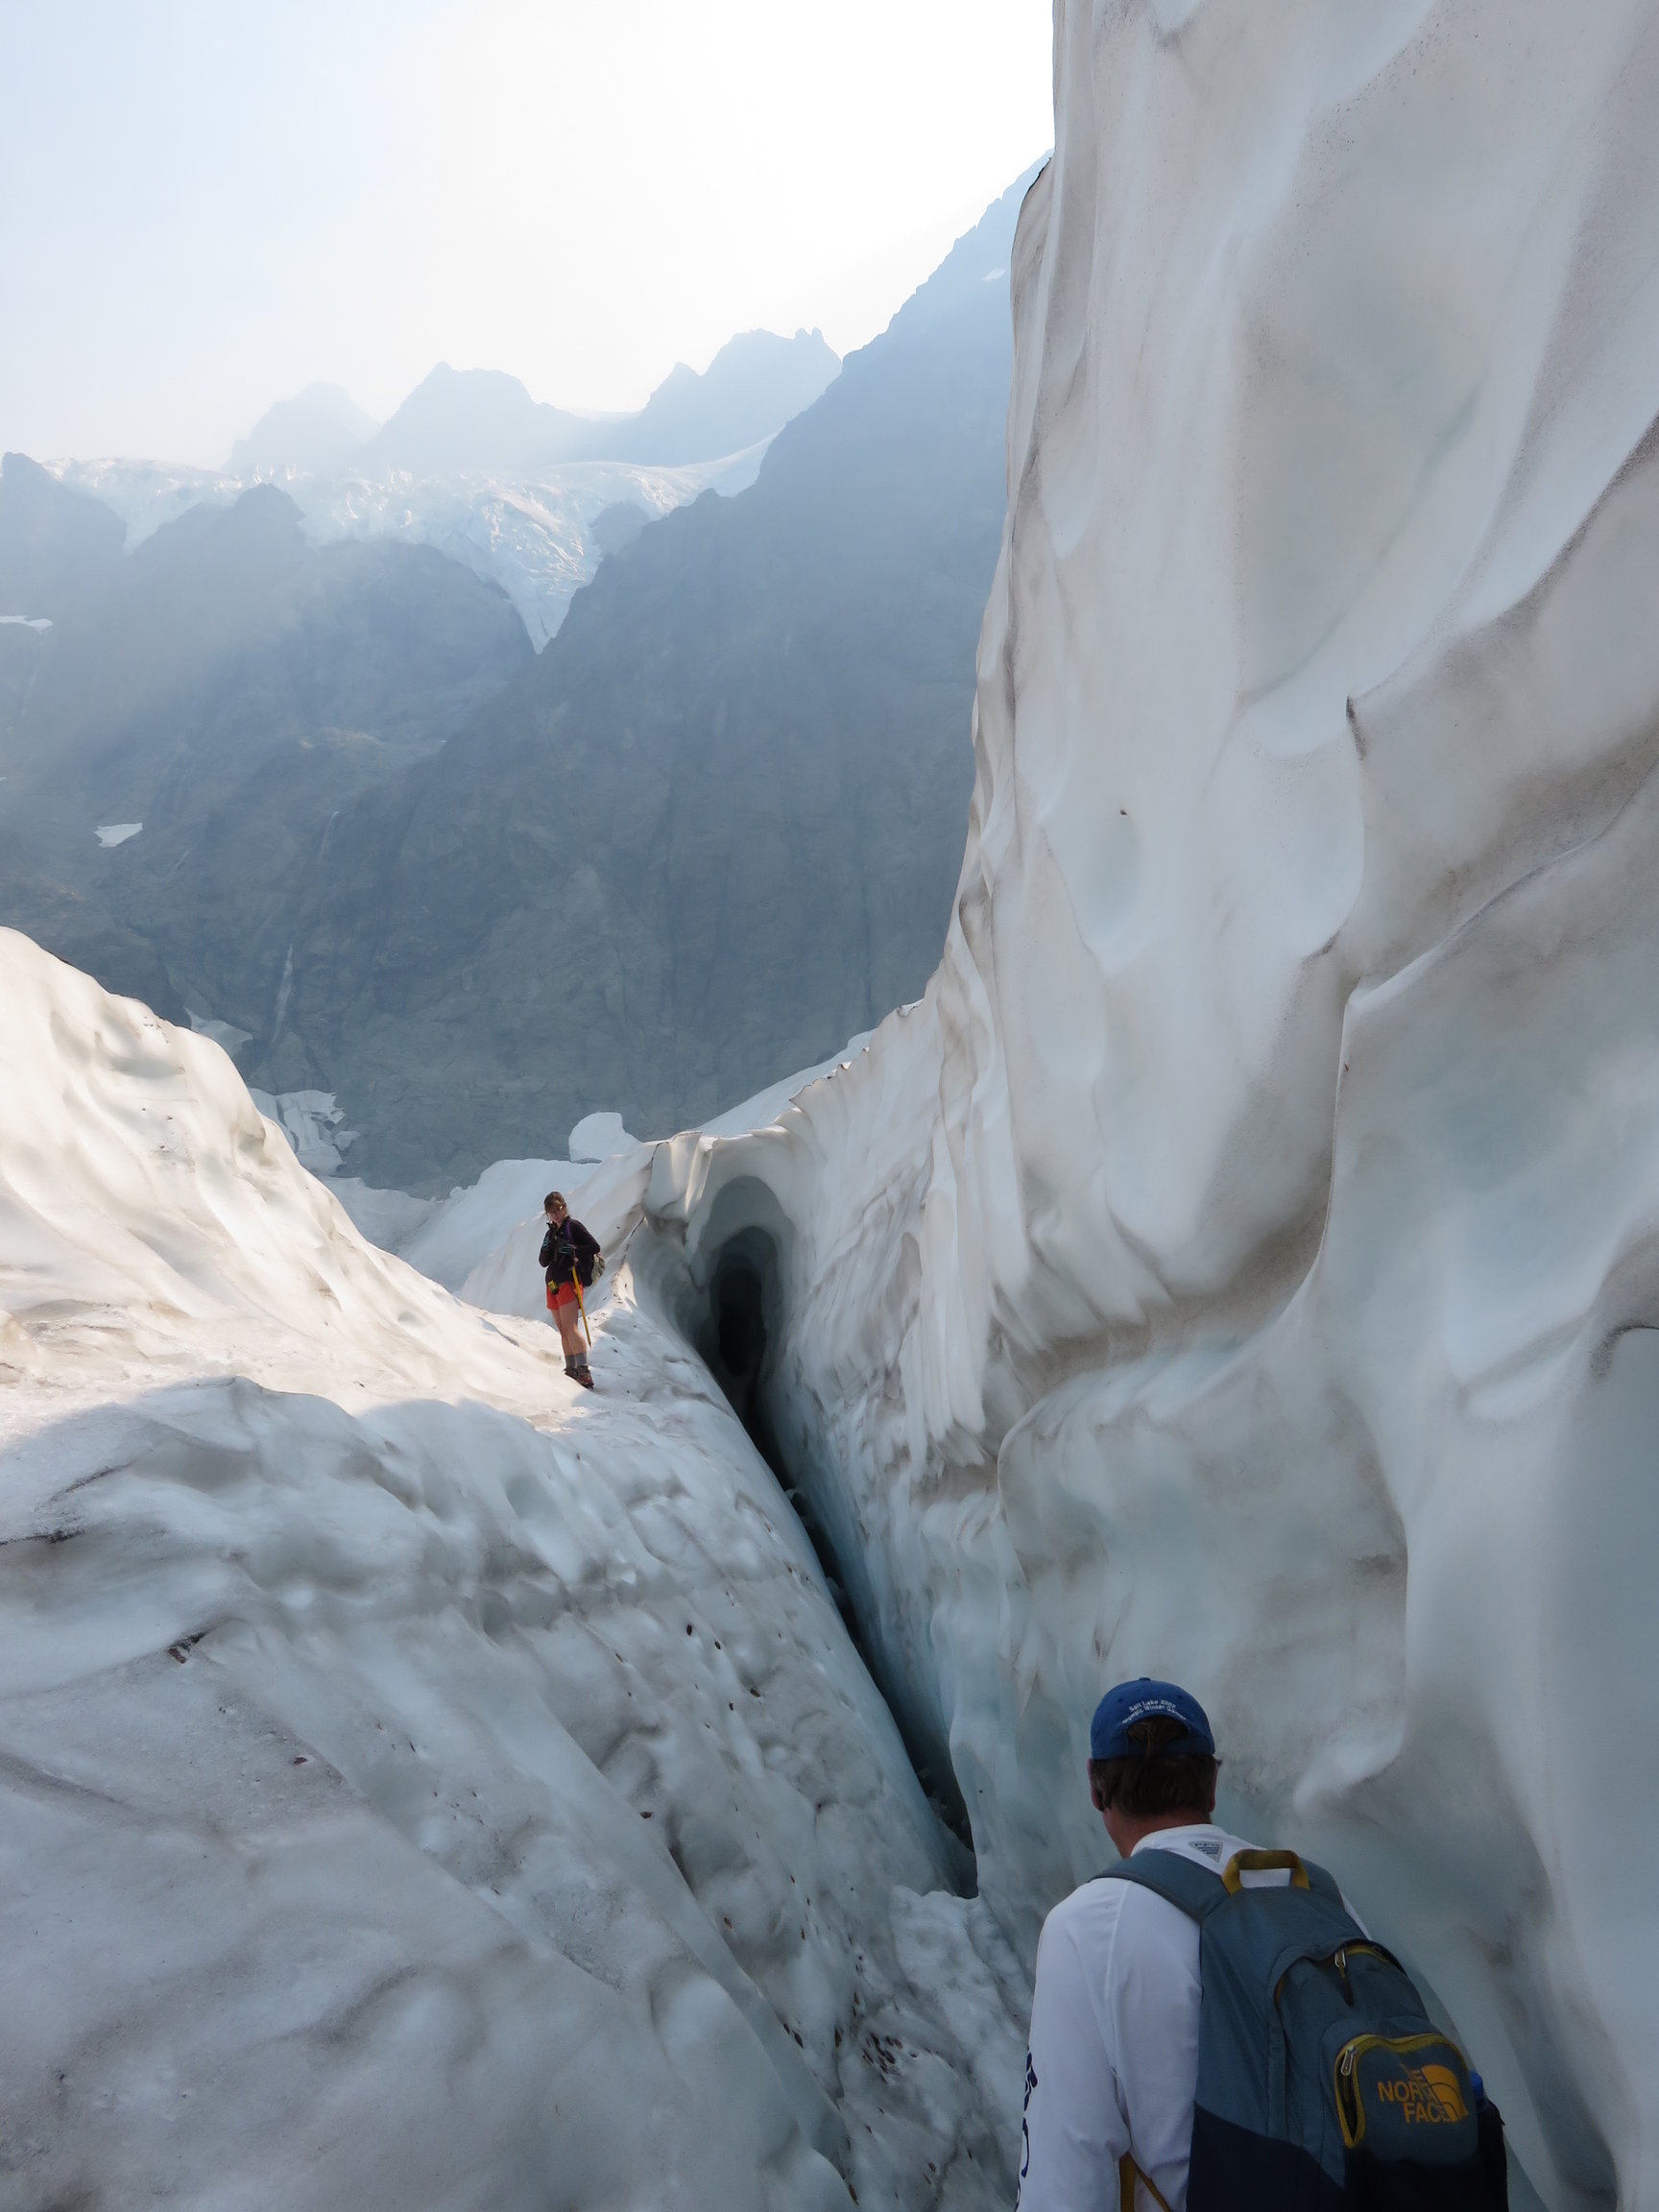
Exploring a crevasse. Note wildfire smoke wreathing the crags of Mount Shuksan.
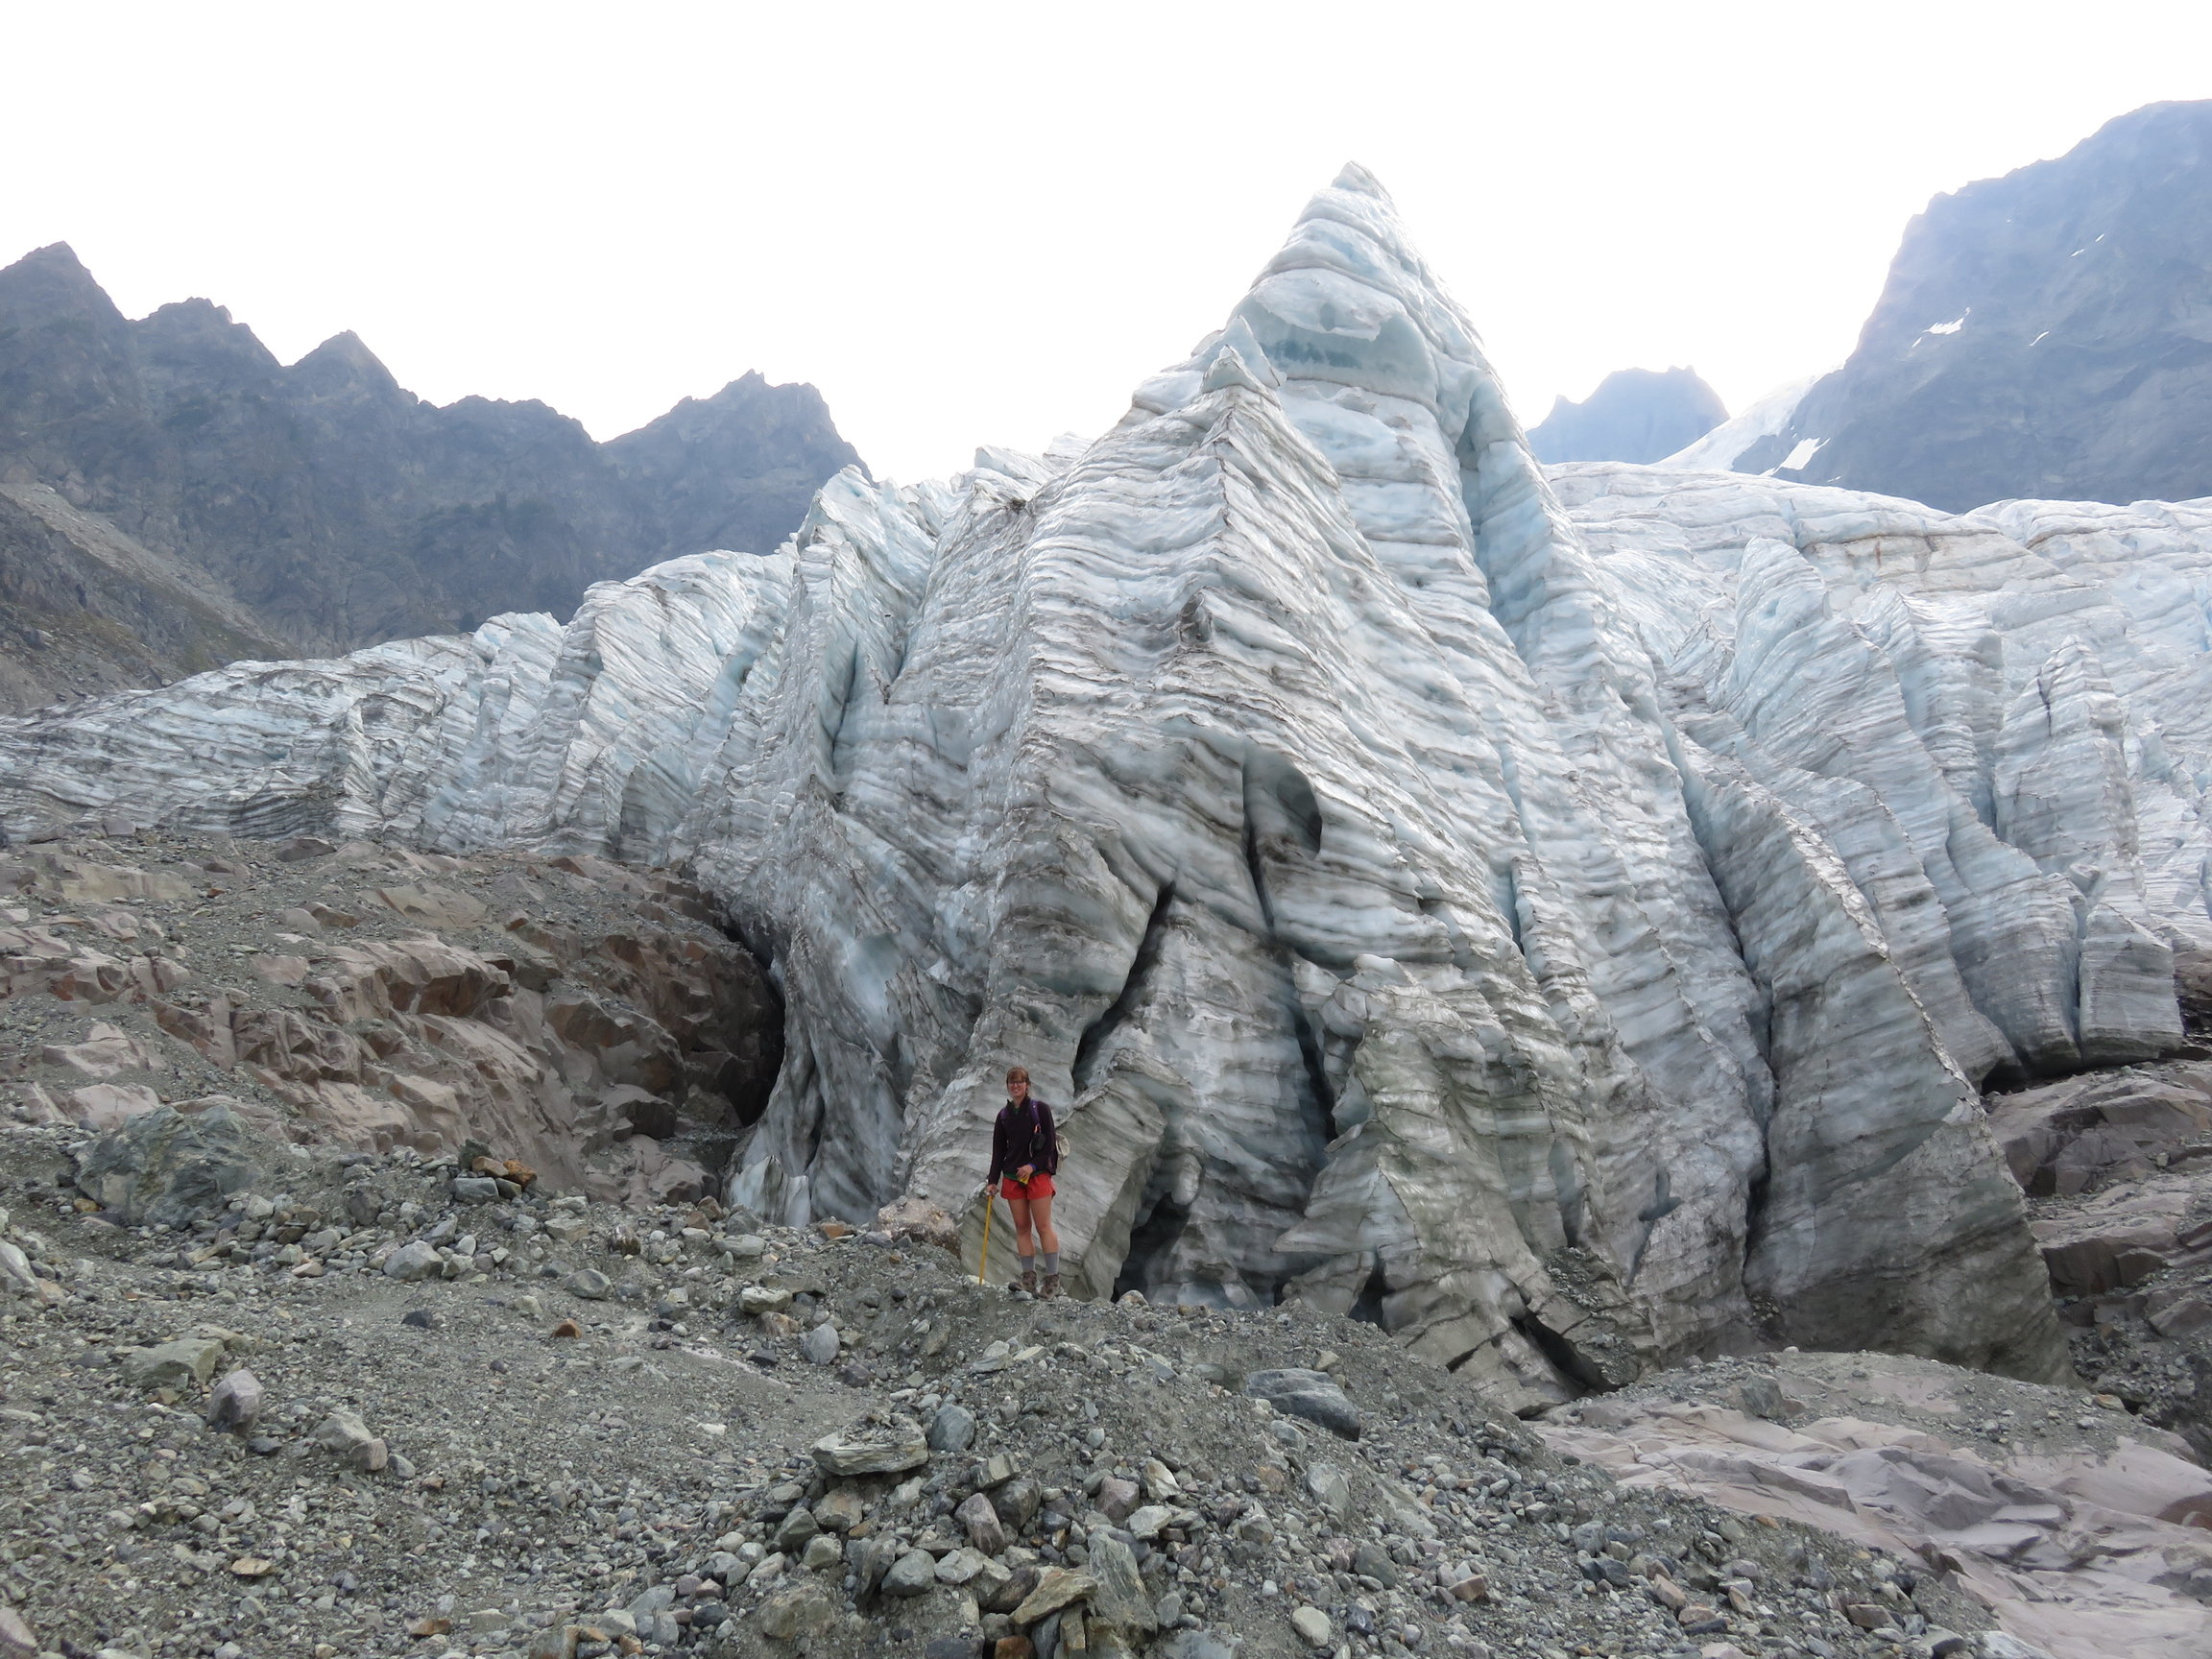
The terminus of the Lower Curtis Glacier. The glacier reached the point I’m standing just last year! This glacier, whose water flows through two hydroelectric projects and supports hundreds of farms in the Skagit Valley while fueling some of the largest salmon runs in the contiguous United States, is doomed.
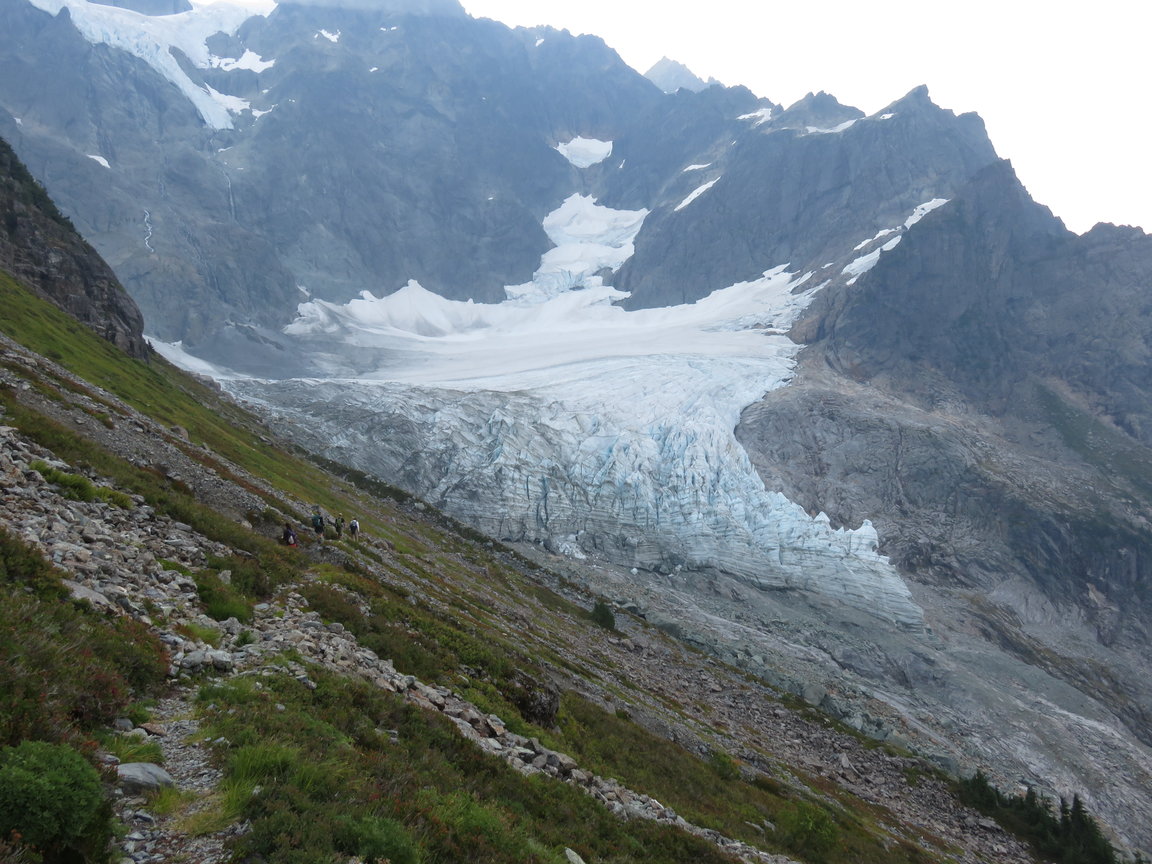
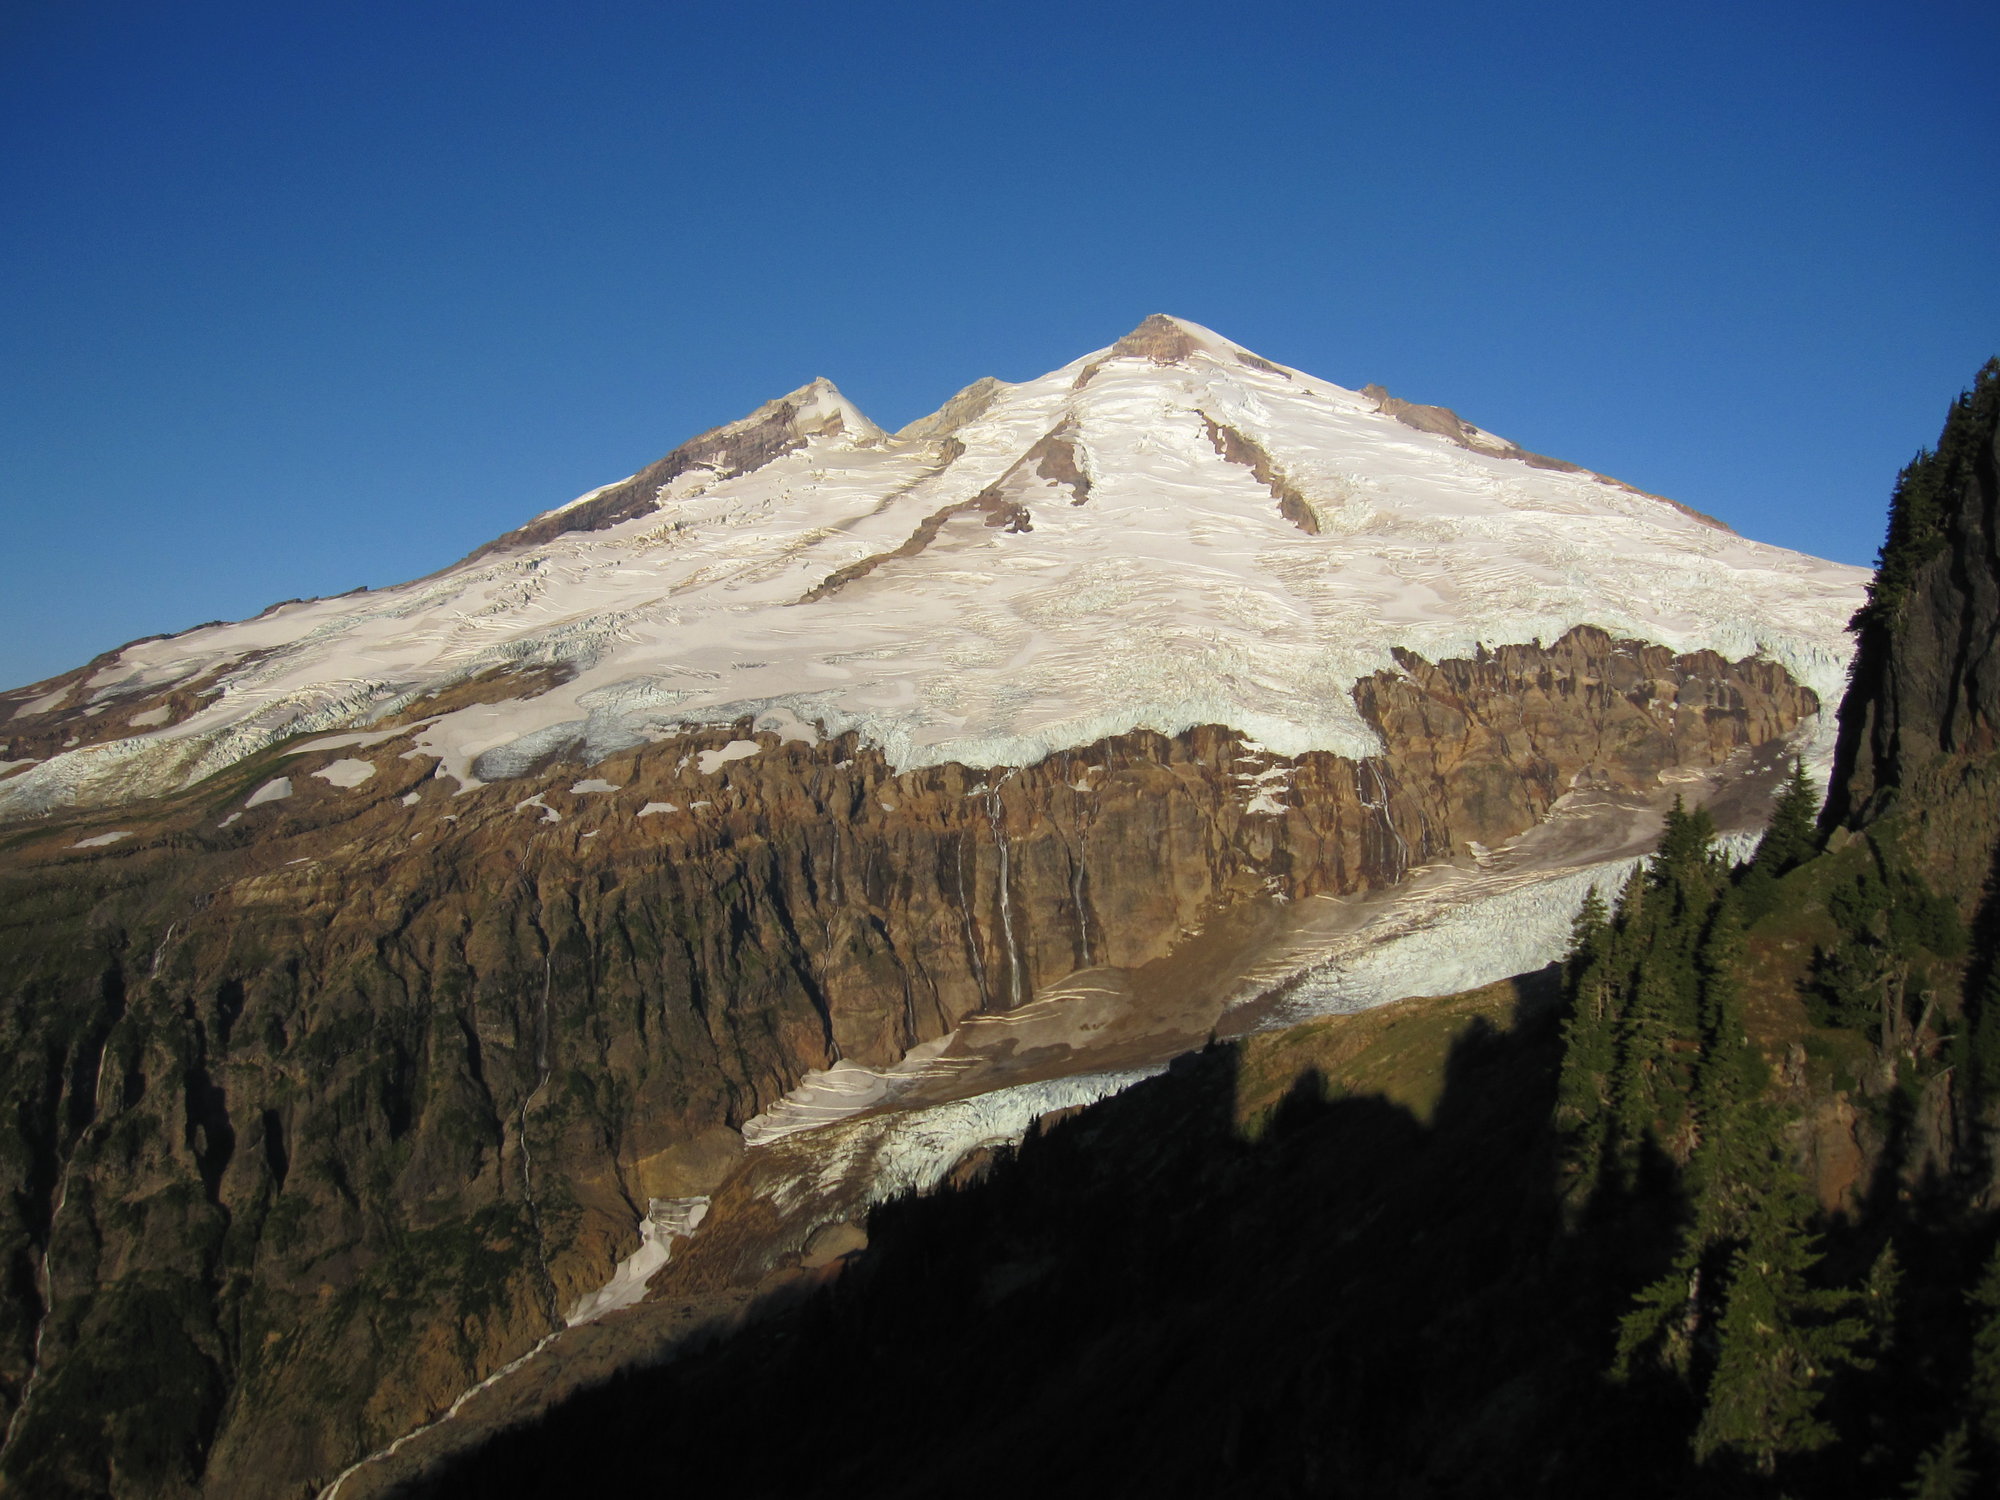
NCGCP 2015 team makes their way to the Lower Curtis Glacier. Note debris covering the glacier — the accumulated material from years of avalanches and rockfall concentrated on the surface as a result of incredible melting.
Even our methodology had to be modified due to the lack of snow. In a creepy irony, the very thing (snow) that is used to accurately measure melt didn’t exist — one can’t measure what isn’t there. It doesn’t take a climate scientist to know that isn’t good.
Mauri and I have our respective estimates of how long the Columbia Glacier will be around. I say 70 years, Mauri closer to 100. But I think these numbers need to be revised. 2015 sets a new baseline for centuries past, and for what is to come. The pace is accelerating from everything I can tell.
I often hear the question, “Doesn’t the work and explorations on the glaciers make you depressed and/or angry?” I explain that when I first started exploring, I was upset, and indeed made a point of visiting certain places to see glaciers before they disappeared. But over time I came to accept it and to focus on being thankful for the chance to witness planetary processes in action, especially in such a magnificent setting.
This time was different. I’ve never felt so down and irritable coming off a mountain trip. What is usually an uplifting experience that fuels my being was filled with anxiety and unease.
All planetary/atmospheric/climate scientists stress the difference between weather and climate: no one weather event such as a big storm, or even an entire season, can be used as direct evidence of global warming. At the same time, there’s talk that the extreme winter season of last year provides a view of what the future will look like. I find that take curious, considering this event has happened and is now a part of the past, and thus informs the present.
The source of the year’s weather can be traced to the unusual “blob” of warm water persisting off the west coast of North America. That in turn can be traced to a persistent ridge of high pressure that I believe is the result of a sync of the Pacific Decadal Oscillation (PDO) and El Niño (ENSO -El Niño Southern Oscillation). These ocean/wind currents promote warm water off the West Coast, but things have not been this warm, for this long, well, in recorded history. There is a bit of a signal that these do sync about every 20 years (see 1975, 1995 and now), but 2015 is a cut above, and most importantly, raises the entire baseline. One thing this really points to is the fact that the planet’s atmosphere and ocean are inextricably linked—one might say the atmosphere is an appendage of the ocean.
A version of this article originally appeared in the The Wild Cascades, the journal of the North Cascades Conservation Council (NCCC). Founded in 1957 in large part by faculty and staff of the University of Washington, this all-volunteer group has as its mission “To protect and preserve the North Cascades’ scenic, scientific, recreational, educational, and wilderness values.” The NCCC is responsible for the creation of North Cascades National Park, as well as many wilderness areas such as Alpine Lakes, Pasayten, Glacier Peak, Wild Sky, Boulder River, and more. UW-IT Technology Project Manager Tom Hammond is the current president of the NCCC. You can support the NCCC by becoming a member or donating through the Combined Fund Drive (charity code 1481136). Visit www.northcascades.org to learn more.