Urchin Web Stats
You can view statistics of usage on www.washington.edu by using Urchin. At this time, the stats are loaded in monthly, so you can view stats from the previous month. The stats are kept for two years.
This document only provides a general overview of how to use Urchin. More complete documentation is available at http://help.urchin.com/. Information is also available at the bottom of each Urchin page.
It should be noted that Urchin is designed to collect information about a site as a whole. It is unable to report on many things on a per-page basis, such as remote host information, browser types, or referring pages. If you wish to have more comprehensive reports, you will need to look at other solutions, such as Google Analytics.
What is Urchin?
Urchin is a web statistics package which is made available for use in analyzing www.washington.edu log files. It is not available for use with other web sites such as depts.washington.edu or students.washington.edu. You must be a www.washington.edu developer to use Urchin.
Getting Started
The statistics generated by Urchin are available at:
http://www.washington.edu/stats/www.washington.edu/
Urchin loads many small images and scripts, so you will need to be patient if you're using a slow connection.
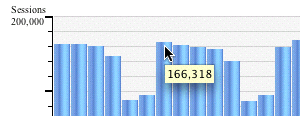
 If your browser can display SVG objects, Urchin will provide a richer interface. For example, this image shows a graph without the SVG viewer. The number in the yellow box represents the number of hits for the entry. This happens when the pointer hovers over one of the bars.
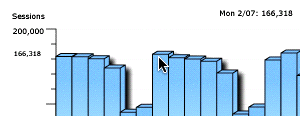
 If you have the SVG plug-in, the same graph is shown to the right. At first this only looks a little different than the previous image, but you'll note that the number of hits are shown both on the left and at the top
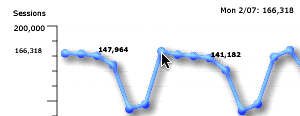
 While it may seem that SVG doesn't change your viewing experience, you can also choose other kinds of graphs, such as the line graph at the right. The extra number entries show up because those data points were clicked, which toggles whether those numbers appear. This feature is also available on the bar graph, as well as pie charts.
If you need an SVG plug-in, one is available from the Adobe SVG Zone.
Selecting Date Ranges
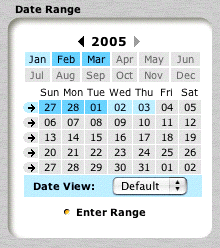
 The most common way to view statistics is by month. You'll see a calendar in the Date Range box (shown at right), and clicking on a month will change the date range to that entire month.
If you wish to show stats for a particular day, you can click on the date in which you are interested. The arrows select an entire week.
You can also view usage per-hour instead of daily by changing the Date View menu.
You'll see that Urchin offers an option to select an arbitrary date range. Beware that sometimes Urchin will have problems with large date ranges; it's normally best to stick to month, week, or day date ranges.
Viewing Page Usage
Urchin allows you to either view statistics for all pages or viewing by directory. Since all files on www.washington.edu are represented in the statistics, you'll want to narrow your view to your particular directory or pages.
For most reports, you can select between pages and files. Pages can be HTML files, results of CGI or PHP scripts, and other things which are pages. Files include all kinds of objects, including images, CSS files, and Javascript files. In other words, Pages are what initially gets sent to the browser, but not the images, etc. references by that pages.
You may have noticed in the examples above that the graphs are showing sessions, not pages or files. Urchin attempts to track when a user first comes to the site and follows all of the pages viewed by that particular user. All of these page and file hits are consolidated into a single session.
Whether you view stats for all pages or view by directory, you will be making selections in the Reports section. The first step is to click on the Pages and Files link, which will give you a list of report types.
All Pages
To view information of all the pages, click on Requested Pages.  You'll see a list of the top ten pages, and you can change how many items show up per page. You will want to filter on your URL to narrow the view to just your pages. For example, the stats for the webinfo pages (which have a URL of http://www.washington.edu/webinfo/) you would type
 /webinfo/ in the Filter box, as shown on the right.
Directory Drilldown
To find your pages by directory, click on the Directory Drilldown link (under Pages and Files), and then click on Directory by Pages Drilldown. At this point, you'll need to find your directory by filtering on each component of your URL, which can involve several steps.
 As an example, if we wish to find statistics for http://www.washington.edu/webinfo/case/flyout/, our first filter would be for
 webinfo. After we hit return, we click on the folder to the left of the /webinfo entry (see example on the right). We then click on the folder next to /case, then the folder next to /flyout.
 If your browser can display SVG objects, Urchin will provide a richer interface. For example, this image shows a graph without the SVG viewer. The number in the yellow box represents the number of hits for the entry. This happens when the pointer hovers over one of the bars.
 If you have the SVG plug-in, the same graph is shown to the right. At first this only looks a little different than the previous image, but you'll note that the number of hits are shown both on the left and at the top
 While it may seem that SVG doesn't change your viewing experience, you can also choose other kinds of graphs, such as the line graph at the right. The extra number entries show up because those data points were clicked, which toggles whether those numbers appear. This feature is also available on the bar graph, as well as pie charts.
 The most common way to view statistics is by month. You'll see a calendar in the Date Range box (shown at right), and clicking on a month will change the date range to that entire month.
 You'll see a list of the top ten pages, and you can change how many items show up per page. You will want to filter on your URL to narrow the view to just your pages. For example, the stats for the webinfo pages (which have a URL of http://www.washington.edu/webinfo/) you would type
  As an example, if we wish to find statistics for http://www.washington.edu/webinfo/case/flyout/, our first filter would be for