
A University of Washington-led team investigated whether fewer cars on the road due to stay-at-home orders led to cleaner air.Sasha • Stories / Unsplash
Starting in mid-March, many states issued stay-at-home orders or encouraged people to work from home to try to curb the spread of COVID-19. In cities nationwide, daily traffic dropped.
But did fewer cars on the road lead to cleaner air? Not necessarily, according to a new study led by University of Washington researchers.
Using air quality data from U.S. Environmental Protection Agency monitors across the U.S., the research team looked for changes in two common pollutants: ozone, and fine particulate matter called PM2.5. Compared to the past 10 years, neither pollutant has been consistently lower than expected levels since stay-at-home orders began. But the team found that another pollutant that mainly comes from car exhaust, NO2, was at much lower levels in three cities — Seattle, Los Angeles and New York — (30% lower on average) after stay-at-home orders were implemented.
Update Jan. 27, 2021: The paper was originally posted on the preprint server ChemRxiv, but it has now been peer reviewed. It published online Jan. 2 in Science of the Total Environment. This release has been edited to reflect that change.
“It’s difficult to determine whether the air really is cleaner now because, in general, there is a lot of variability in weather and emissions patterns,” said senior author Julian Marshall, a UW professor of civil and environmental engineering. “You can’t look solely at concentrations today and compare them to the same day a month or a year ago.”
Because pollutant concentrations vary over time and across regions, the researchers developed a method to determine whether pollutant levels in any given week were notably different from normal.
“Let’s say you’re measuring height and you want to know if a difference of 2 inches is a big deal. Well, it depends on how much variability there is,” Marshall said. “If you measured the height of people in a city and then you have someone who’s 2 inches taller than the average height, you’d probably say they’re still about average because people’s height varies by feet. But if you found an NBA hoop rim that was 2 inches different from the average, that’s a big deal. Rim height is so precisely controlled.”
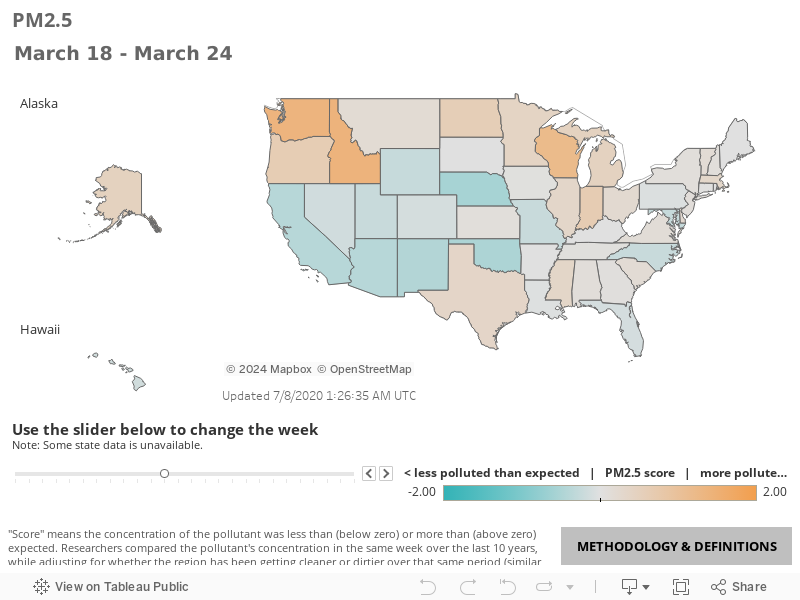
The team’s “robust differences” metric compares a pollutant’s median concentration during a week in 2020 to its median concentration in the same time period over the past 10 years. The metric also adjusts for whether a region has been getting cleaner or dirtier over the past 10 years, a lot like adjusting prices for inflation. This calculation yields a score where negative numbers indicate that a region was cleaner than expected for that week, and positive numbers indicate that a region was dirtier than expected.
The researchers attempted to calculate the robust differences score for the nearly 1,000 PM2.5 and the more than 1,170 ozone monitors across the U.S. But the team excluded monitors that had less than three years of data or were missing data from at least two of the last three years. West Virginia didn’t have any PM2.5 monitors that qualified, and Rhode Island, South Carolina and Hawaii didn’t have ozone monitors that qualified. For all other states, the team used individual monitor data to calculate state-level scores.

Lead author Bujin Bekbulat, a UW doctoral student in civil and environmental engineeringSasha Im/University of Washington
California was the first state to issue a stay-at-home order, on March 19. That week, average PM2.5 levels across the country were slightly (5%) higher than expected. Since then, PM2.5 levels have continued to be similar to expected values, as of June 17, when this story was initially published. Editor’s note: The maps and graphs in this story will continue to be updated. See them for current information.
PM2.5 levels in individual states also fluctuated over time, which is normal depending on what’s happening with emissions and weather patterns, the researchers said. But in general, the team didn’t see any trends of states being consistently cleaner or dirtier over time.
“Everyone was saying that pollution had to be lower after the stay-at-home orders went into effect,” said lead author Bujin Bekbulat, a UW doctoral student in civil and environmental engineering. “But that’s not what we saw across the U.S. It was very surprising.”
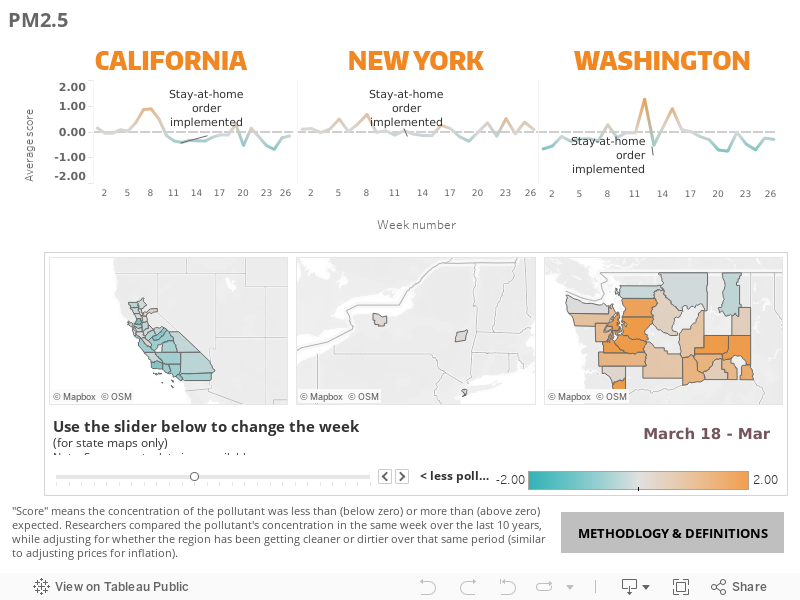
While the researchers analyzed all states that had enough data, this article highlights three states with stay-at-home orders and large metropolitan areas: Washington, California and New York. As of June 17, Washington had higher PM2.5 levels than normal the week before its stay-at-home order went into effect, and the levels have bounced around since then. Meanwhile, California had lower PM2.5 levels than normal before its stay-at-home order, and that has gradually increased. New York only had a few counties reporting data, but in those counties, PM2.5 levels remained relatively consistent over the course of 2020.
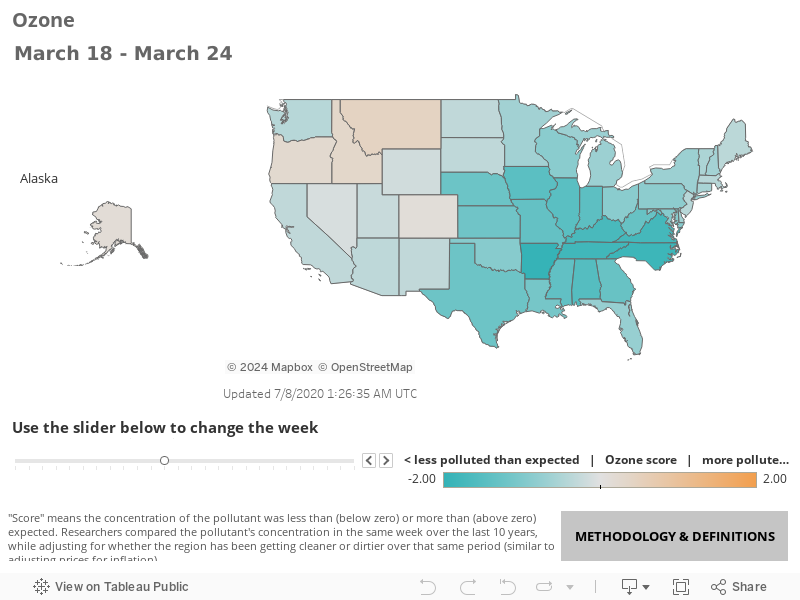
Across the country, ozone levels dropped below expected values before stay-at-home orders were issued and have increased since then, reaching expected values by early May. As of June 17, when this story was initially published, ozone levels continued to be similar to expected values. Ozone levels often change over time, the researchers said, depending on what’s happening with emissions and the weather.
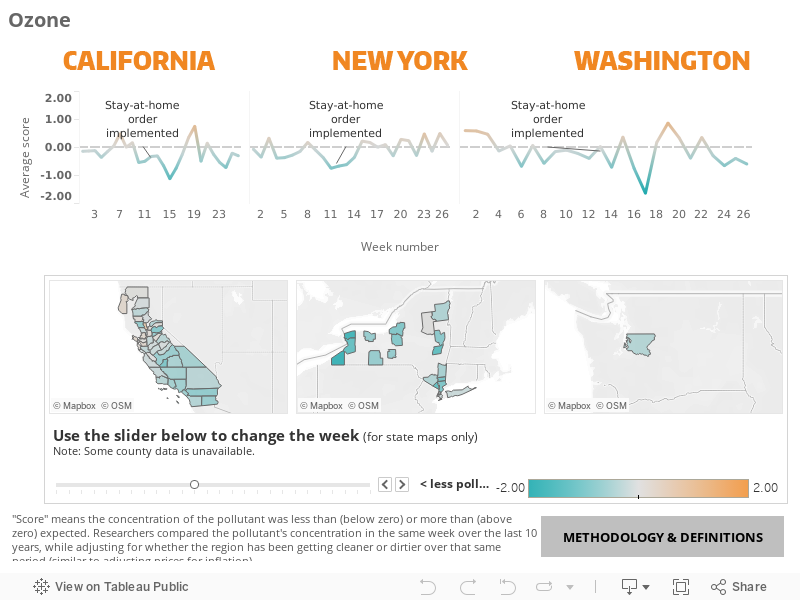
Similar to the PM2.5 data, ozone levels varied by state. For example, New York’s ozone levels were similar to the national trend. California had lower ozone levels before the stay-at-home order and those levels gradually increased to higher than expected before dropping again the week of May 13. Washington only had one county reporting ozone data – King County – and its ozone levels were within the expected range when the stay-at-home order went into effect. Since then, the levels have fluctuated between lower and higher than expected.
While the team didn’t see any consistent drop in ozone and PM2.5 levels, the researchers wondered if NO2, a pollutant that’s more closely linked to car exhaust, would be affected by fewer people on the road. The EPA has not posted NO2 levels for 2020 yet, so the team used data for Seattle, Los Angeles and New York City from a website that tracks NO2 levels in cities across the world.
NO2 levels for all three cities were lower than expected the week of all three states’ stay-at-home orders, with Seattle 46% lower, Los Angeles 56% lower and New York City 46% lower. These levels generally have remained below normal values, as of June 17. These findings are consistent with recently reported NO2 observations by satellites, the researchers said.
NO2 Data
“Everybody thinks that because so many people are not driving the air is really clean, but it really depends on what type of pollution you’re talking about,” Bekbulat said. “Cars are the main contributor to NO2 levels, which are down, so there’s something to people’s intuition. But we’re still using electricity, and that power plant is generating emissions. When it’s cold, people still burn fires, and that generates emissions. Meteorology plays a role, too: Stagnant air tends to be dirtier. There are all kinds of things happening that could explain why we think we’re all shutting down, but pollution levels don’t show that.”
Other co-authors on this paper are Joshua Apte at the University of Texas at Austin, Dylan Millet and Kelley Wells at the University of Minnesota, and Allen Robinson at Carnegie Mellon University. This publication was developed as part of the Center for Air, Climate, and Energy Solutions, which was supported under an Assistance Agreement awarded by the U.S. Environmental Protection Agency.
For more information, contact Marshall at jdmarsh@uw.edu and Bekbulat at bujinb@uw.edu.
Grant number: R835873. This research has not been formally reviewed by EPA. The views expressed in this document are solely those of the authors and do not necessarily reflect those of the Agency. EPA does not endorse any products or commercial services mentioned in this publication.
Tagged with: College of Engineering, COVID-19, COVID-19 studies, Department of Civil & Environmental Engineering, Julian Marshall, population health, preprint