December 6, 2007
UW greenhouse gases down 10 percent from 2001 to 2005, inventory finds
The UW’s first inventory of greenhouse gas emissions shows that the University reduced overall emissions 10 percent from 2000 to 2005. The inventory includes emissions from the UW Seattle, Tacoma, and Bothell campuses and from other facilities that the UW owns or operates.
The gases inventoried include: carbon dioxide, methane, nitrous oxide, sulfur hexafluoride, hydrofluorocarbons and perfluorocarbons. The report was prepared as part of the UW’s participation in the American College and University Presidents Climate Commitment and the Seattle Climate Partnership. The report was compiled by Roel Hammerschlag, a recent master’s degree graduate of the UW’s Evans School of Public Affairs.
“This is a remarkable achievement,” says Sandra Archibald, dean of the Evans School and chair of the Environmental Stewardship Advisory Committee. “We believe the potential for future progress is great. There is a tremendous capacity at the UW to develop and implement programs to keep us at the forefront nationally in campus sustainability. One of the most important things we can do, as individuals, is to consider the actions we can take in our daily decisions to reduce production of greenhouse gases.”
The study showed that direct emissions were down 9.3 percent over the five-year period. These include emissions from the power plant (which provides heating for 200 buildings and chilled water for air conditioning in 50 buildings), the Montlake Landfill (which releases methane) buildings which generate their own heat and UW-owned vehicles. These decreases were achieved despite increases in the UW population of more than 8 percent.
The UW has an aggressive program of energy conservation that has been in place for over a decade. Interior building temperatures are set to 68 degrees F; most buildings are not air conditioned. The University has transitioned to using energy-efficient lighting throughout its buildings. The power plant boilers all use natural gas as the primary fuel. The boilers are high efficiency with reduced nitrogen oxide emissions.
All new campus construction and renovation is conducted to ensure that buildings meet sustainability standards. The UW as a matter of policy promotes sustainability in land use, development and construction projects.
Greenhouse gases attributable to energy purchased by the University fell 69.5 percent. This drop occurred chiefly because Seattle City Light began delivering electricity to the UW with zero net greenhouse gas emissions (mainly hydroelectric and wind power) in 2005. The UW also uses a centralized energy management and monitoring system, which helps in making decisions that can save energy.
“Other emissions” rose 7.8 percent. Greenhouse gases attributable to commuting and travel increased, mainly due to increased commuting populations and increased commuting distances by faculty, staff and students. Still, the UW’s award-winning U-PASS program decreased the percentages of UW Seattle employees and students who drive alone from 25 percent in 2000 to 23 percent in 2005 and increased the percentage who take transit from 31 percentin 2000 to 38 percent in 2005.
The report also notes that, while not officially part of the inventory, the UW has an aggressive program of waste management and recycling that has resulted in a reduction of about 10 percent in greenhouse gas emissions from solid waste disposal. The UW also manages forest land that is responsible for removing a significant amount of greenhouse gases from the atmosphere. Harborview Medical Center, which is owned by King County but managed by the UW, reduced emissions by 25 percent.
The UW is in the process of preparing an action plan for future reduction of the university’s carbon footprint. The complete inventory is available for viewing at http://www.washington.edu/admin/facserv/conserve.php. A summary of important figures is below.
Gross emission 2000 2005 | Emission intensity 2000 2005 | |||
Scope 1 – direct emissions | ||||
Seattle | ||||
Power plant | 90,500 | 82,700 | 1,530 | 1,310 |
Buildings | 5,080 | 6,440 | 86 | 102 |
Vehicles | 3,030 | 3,040 | 51 | 48 |
Landfill | 17,000 | 12,800 | 287 | 201 |
Fugitive gases | 1,820 | 136 | 31 | 2 |
Total | 117,000 | 105,000 | 1,990 | 1,660 |
Tacoma | ||||
Buildings | 341 | 699 | 184 | 285 |
Vehicles | 10 | 12 | 6 | 5 |
Fugitive gases | n.d. | n.d. | n.d. | n.d. |
Total | 351 | 710 | 190 | 289 |
Bothell | ||||
Buildings | 258 | 622 | 158 | 332 |
Vehicles | 133 | 61 | 81 | 32 |
Fugitive gases | n.d. | n.d. | n.d. | n.d. |
Total | 392 | 683 | 239 | 364 |
Outlying facilities | 221 | 239 | 1,870 | 1,870 |
University-wide | 118,000 | 107,000 | 1,890 | 1,570 |
Scope 2 – electricity | ||||
Seattle | ||||
Central loop | 16,100 | – | 274 | – |
Other | 8,390 | 4,670 | 142 | 74 |
Total | 24,500 | 4,670 | 416 | 74 |
Tacoma | 629 | 343 | 340 | 140 |
Bothell | 664 | 2,730 | 406 | 1,460 |
Outlying facilities | 46 | 144 | 390 | 1,130 |
University-wide | 25,900 | 7,890 | 413 | 116 |
Scope 3 – other emissions | ||||
Seattle | ||||
Student commuting | 19,100 | 21,800 | 324 | 345 |
Faculty & staff commuting | 27,000 | 32,700 | 459 | 517 |
Professional travel | 16,700 | 18,700 | 283 | 295 |
Off-campus medical | 16,700 | 12,600 | 282 | 198 |
Total | 79,500 | 85,800 | 1,350 | 1,350 |
Tacoma | 2,150 | 2,340 | 1,160 | 955 |
Bothell | 1,390 | 1,570 | 849 | 837 |
Outlying facilities | 55 | 62 | 469 | 485 |
University-wide | 83,100 | 89,800 | 1,330 | 1,320 |
Grand totals | ||||
Seattle | 221,000 | 196,000 | 3,750 | 3,090 |
Tacoma | 3,130 | 3,400 | 1,690 | 1,380 |
Bothell | 2,450 | 4,980 | 1,490 | 2,660 |
Outlying facilities | 322 | 445 | 2,730 | 3,480 |
University-wide | 227,000 | 204,000 | 3,630 | 3,010 |
Optional Information | ||||
NSF research vessels | 4,380 | 6,640 | ||
Seattle campus waste | (7,790) | (6,240) | ||
Forest carbon sequestration | (12,200) | (16,400) | ||
University-wide total w/ O.I. | 212,000 | 188,000 | ||
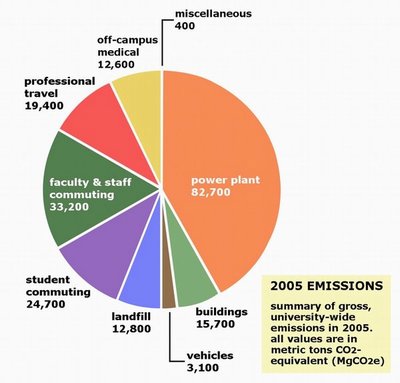
This chart shows the components of the UW’s carbon emissions and how they changed from 2000 to 2005.
Emission intensities are calculated per gross headcount — students, faculty and staff combined.


