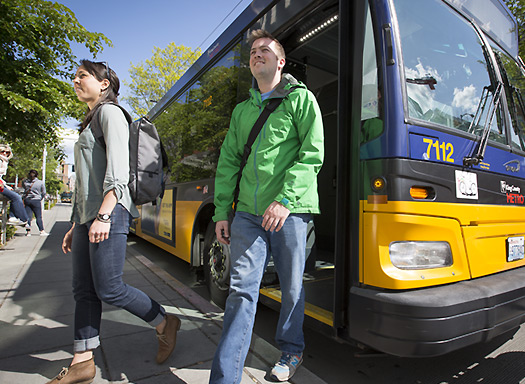
Use your U-PASS to take the bus, light rail, commuter train and more
Bike routes, parking and safety advice
Tips for commuting on foot
Directions to popular campus destinations
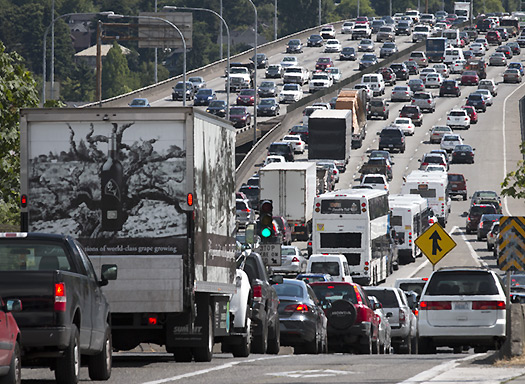
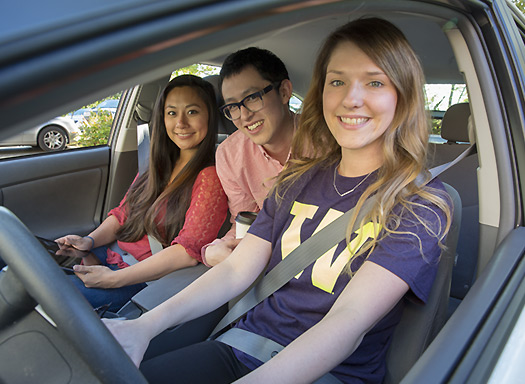
Carpools and vanpools
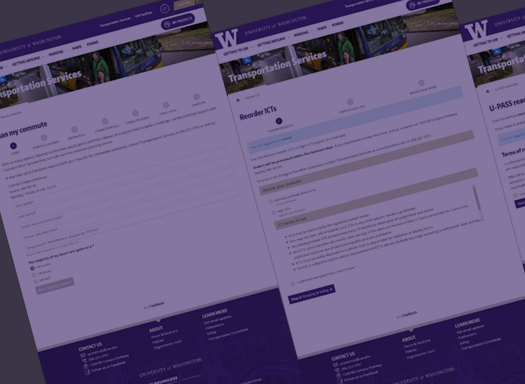
Know what you need? Click and go
Find where you need to go